Figures & data
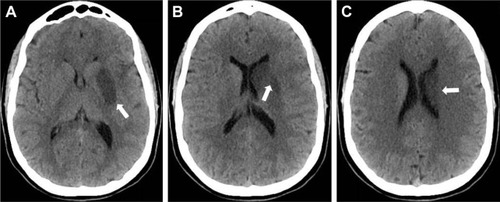
Figure 1 Cerebral CT scan showing spontaneous hyperdensity in the left middle cerebral artery proximal segment M1 (A), lentiform nucleus obscuration (B, arrow 1), loss of gray-white matter discrimination (B, arrow 2), and proximal occlusion of the left middle cerebral artery on CT angiography (C).
Abbreviation: CT, computed tomography.
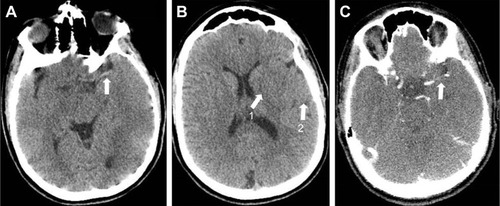
Figure 2 Initial left internal carotid angiogram (lateral [A], and anteroposterior [B] views) showing proximal occlusion of the left middle cerebral artery (white arrow), lack of perfusion in the respective territory, and collateral flow from the left anterior cerebral artery through leptomeningeal anastomoses (black arrows).
![Figure 2 Initial left internal carotid angiogram (lateral [A], and anteroposterior [B] views) showing proximal occlusion of the left middle cerebral artery (white arrow), lack of perfusion in the respective territory, and collateral flow from the left anterior cerebral artery through leptomeningeal anastomoses (black arrows).](/cms/asset/a9b37337-1751-4265-bbe3-76e5a5f7ccab/dtcr_a_166289_f0002_b.jpg)
Figure 3 The 6 mm red clot removed from left middle cerebral artery following endovascular thrombectomy.
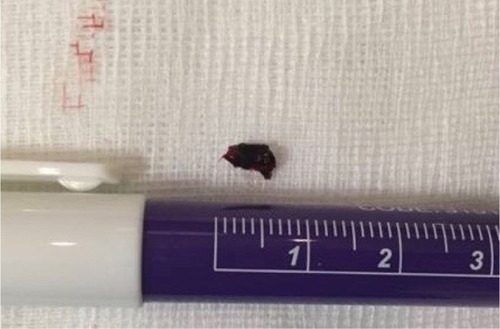
Figure 4 Left internal carotid artery angiogram (lateral [A], and anteroposterior [B] views) showing recanalization (Thrombolysis in Cerebral Infarction [TICI] scale grade IIb), and slight vasospasm (white arrow) of the left middle cerebral artery following mechanical thrombectomy.
![Figure 4 Left internal carotid artery angiogram (lateral [A], and anteroposterior [B] views) showing recanalization (Thrombolysis in Cerebral Infarction [TICI] scale grade IIb), and slight vasospasm (white arrow) of the left middle cerebral artery following mechanical thrombectomy.](/cms/asset/a8890df4-11a6-4f30-adbb-6a9880980bda/dtcr_a_166289_f0004_b.jpg)
Figure 5 Control cerebral CT-scan performed 24 hours after reperfusion therapies showing a left lenticulostriate (A, B) and caudate (C) infarct (white arrows).