
Figures & data
Table 1 Baseline characteristics of all eligible participants
Table 2 Associations of different blood glucose traits and KFD according to DM status
Table 3 Associations of different FPG levels and KFD
Figure 1 Subgroup analyses for the association between KFD and FPG level.
Note: Variables in the model: age, sex, BMI, baseline eGFR (grouped by median value), 2 h-PG, current smoking, current drinking, total cholesterol, triglyceride, hypertension, cardiovascular disease, antihypertensive drugs, hypoglycemic drugs, and lipid-lowering drugs.
Abbreviations: 2 h-PG, 2-hour plasma glucose; BMI, body mass index; eGFR, estimated glomerular filtration rate; KFD, kidney function decline; FPG, fasting plasma glucose.
Abbreviations: 2 h-PG, 2-hour plasma glucose; BMI, body mass index; eGFR, estimated glomerular filtration rate; KFD, kidney function decline; FPG, fasting plasma glucose.
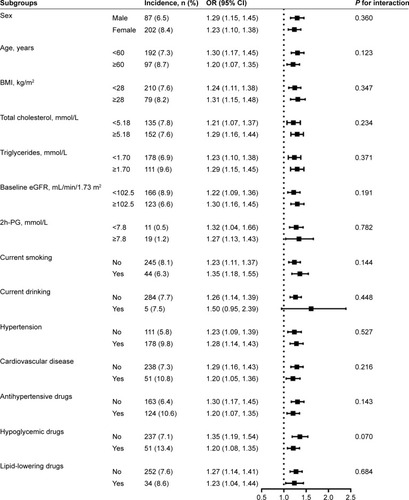
Figure S1 CONSORT flow diagram.
Abbreviations: 2 h-PG, 2-hour plasma glucose; eGFR, estimated glomerular filtration rate; FBG, fasting blood glucose.
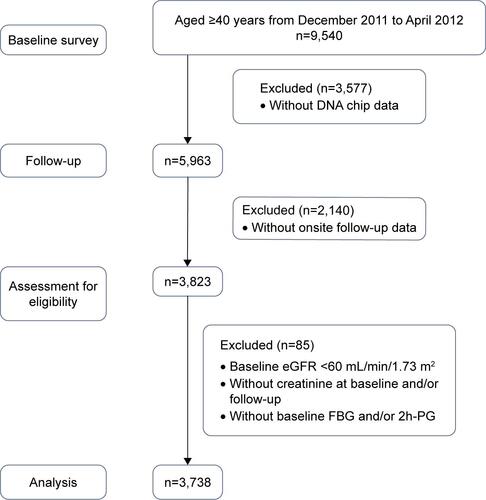
Table S1 STROBE Statement-checklist of items that should be included in reports of observational studies