Figures & data
Table 1 Clinicopathological parameters of 113 breast cancer patients
Figure 1 Peripheral PD-1 mRNA expression in patients with malignant and benign breast tumors.
Abbreviation: PD-1, programmed death 1.
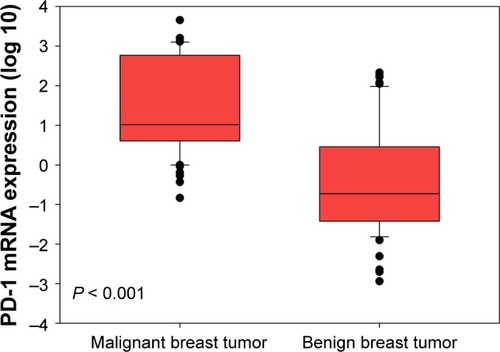
Table 2 Correlation of clinicopathological parameters with BI-RADS classification and peripheral PD-1 expression in breast cancer patients
Figure 2 Comparison of PD-1 expression between patients with malignant and benign breast tumors according to cutoff value.
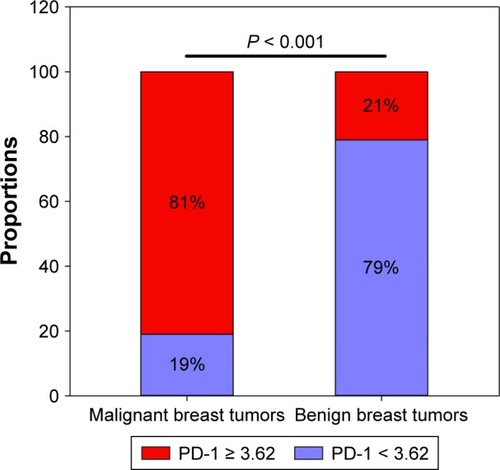
Figure 3 ROC curve for PD-1 detection to differentiate malignant from benign tumors.
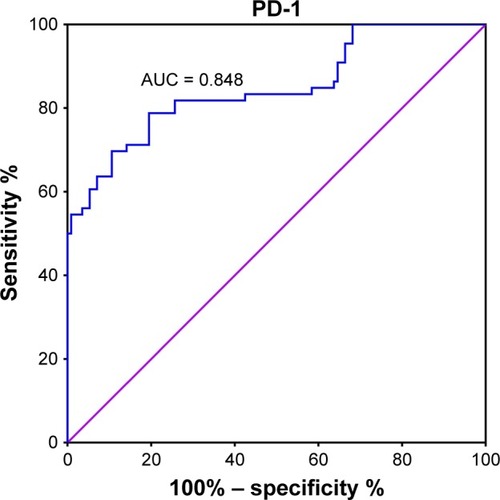
Table 3 Diagnostic value for PD-1 and BI-RADS for ROC curve analysis
Figure 4 Comparison of BI-RADS between patients with malignant and benign breast tumors according to cutoff value.
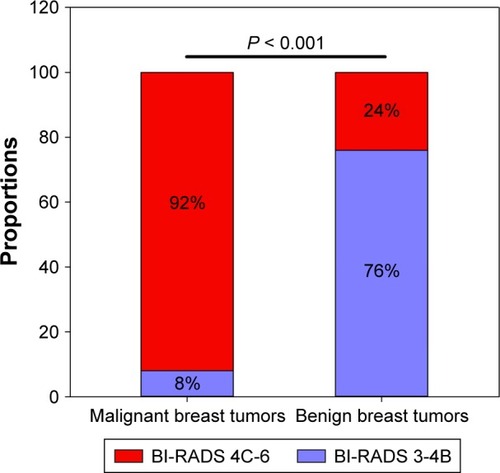
Figure 5 ROC curve for BI-RADS to differentiate malignant from benign tumors.
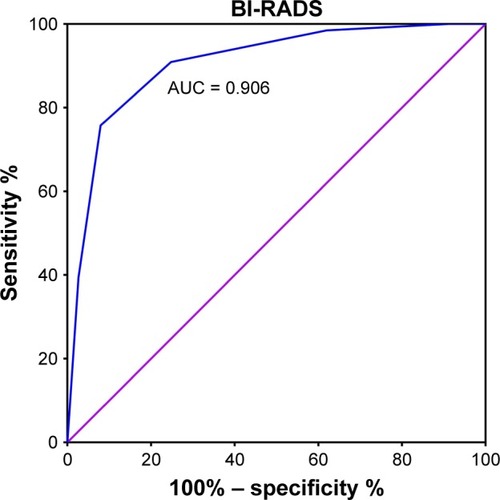
Figure 6 ROC curve for PD-1 detection combined with BI-RADS to differentiate malignant from benign tumors.
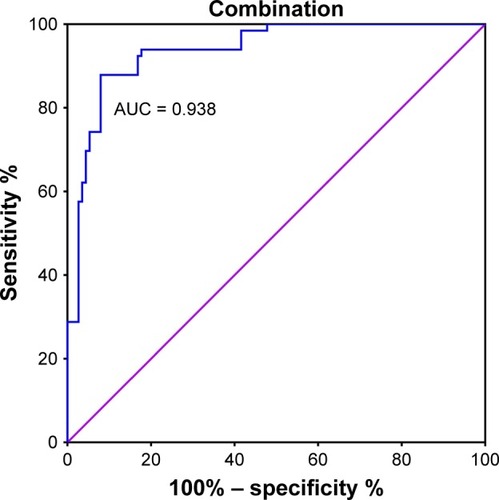
Figure S1 Peripheral PD-1 mRNA expression in patients with malignant and benign breast tumors (comparable age between two groups).
Notes: Median age of breast cancer patients was 41 (24–60) years. Median age of patients with benign breast tumors was 39 (20–60) years.
Abbreviation: PD-1, programmed death 1.
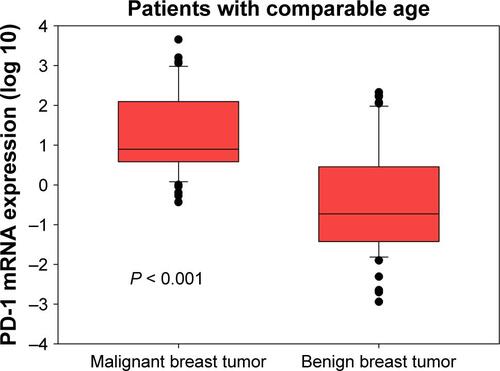
Figure S2 PD-1 expression in high-age group (age > median age) and low-age group (age ≤ median age) in breast cancer patients.
Abbreviation: PD-1, programmed death 1.
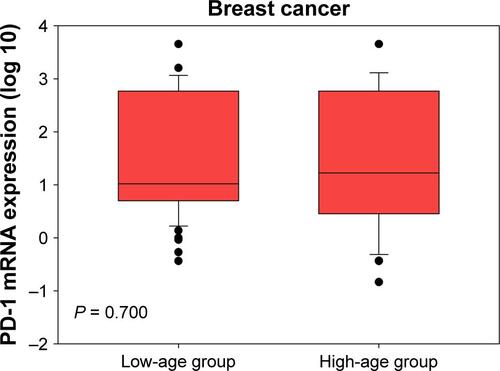
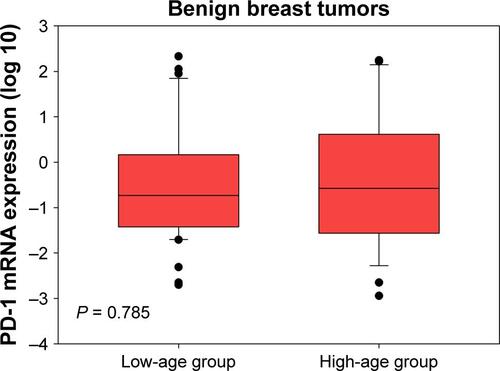
Figure S3 PD-1 expression in high-age group (age > median age) and low-age group (age ≤ median age) in patients with benign breast tumors.
Abbreviation: PD-1, programmed death 1.