Figures & data
Figure 1 Cyclosporine serum concentration following drug titration targeting a trough concentration of 100–200 ng/mL. Shown is the median (solid line) and 90% population exposure range (shaded area) of cyclosporine serum concentration following a dose adjusted to a target trough concentration of 100–200 ng/mL. Derived from PK parameters reported in Lukas et al.Citation3
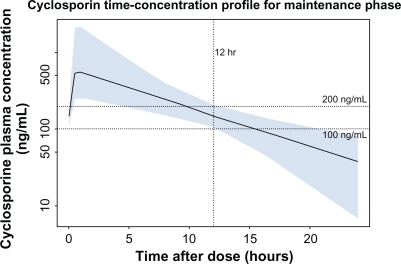
Figure 2 A) Observed distributions of nonadherence patterns in renal transplant patients. Shown are nonadherence patterns observed by Russell et alCitation9 for patients in clusters 1–4 (Ns 14, 8, 6, and 4, respectively; the “Others” category, N = 12, is not presented). Each line represents an individual patient. The ordinate shows the percent days with each adherence pattern, and the abscissa shows the 16 patterns, numbered 0–15; the top row of abbreviations shows the timing of morning dose, and the bottom row, timing of the evening dose. B) Simulated distributions of nonadherence patterns.
Figure 2A was reprinted with permission of John Wiley & Sons, Inc. from Res Nurs Health vol. 29, no. 6, 2006, pp. 521–532.
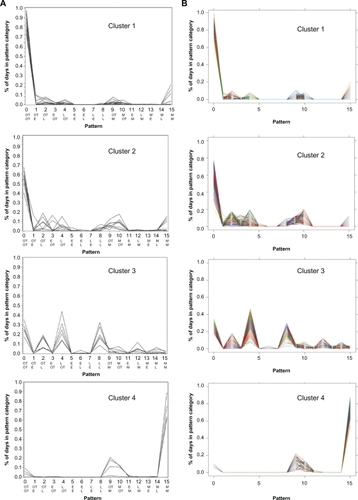
Figure 3 The drug adherence-exposure model. The diagram shows the conceptual framework of the drug adherence-exposure model rather than the temporal sequence of events. The impact of drug nonadherence patterns on the within- and between-individual variability of cyclosporine exposure was quantified by coupling a model of adherence to a dose-exposure model. An adherence model was developed to mimic the 16 nonadherence patterns described by Russell et al,Citation9 and this adherence model was coupled to a previously published population pharmacokinetic (dose-exposure) model for cyclosporine.Citation3 The combined effect of nonadherence patterns and pharmacokinetic characteristics on variability in cyclosporine concentrations was quantified by applying the coupled drug adherence and drug-exposure models to simulate Cavg and Cmin values for 500 patients over a period of 90 days (a total of 45,000 patient-days). Subjects with excessive variability were identified based on threshold levels of variability reported by Kahan et al and Waiser et al.Citation4,Citation5 Individual patients at risk of adverse transplantation outcomes can thus be identified by their nonadherence behavior.

Figure 4 Simulated distribution of the coefficient of variation in cyclosporine Cavg for nonadherence clusters. Vertical dotted line: CV% threshold for Cavg of 28.4%, as defined by Kahan et al.Citation4
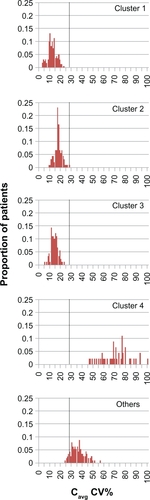
Figure 5 Simulated distribution of the coefficient of variation in cyclosporine Cmin for nonadherence clusters. Vertical dotted line: CV% threshold for Cmin of 36%, as defined by Kahan et al.Citation4 Vertical dashed line: CV% threshold for Cmin of 28.05%, as defined by Waiser et al.Citation5
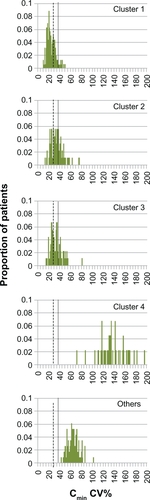
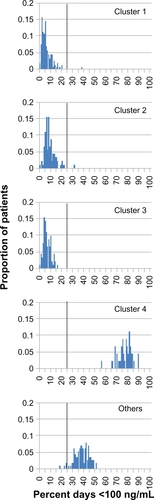
Figure 6 Simulated percentage of days below the cyclosporine Cmin target range for nonadherence clusters. Vertical solid line: 25% of days threshold separating clusters 1–3 from cluster 4 and “Others”.