Figures & data
Figure 1 Visual quantitative grading of coronary artery stenosis using coronary computed tomography angiography. The severity of coronary artery stenosis (arrows) was visually categorized as no stenosis, 1%–24% stenosis, 25%–49% stenosis, 50%–74% stenosis, and ≥75% stenosis. Patients with at least one coronary artery stenotic lesion ≥75% were considered to have significant coronary artery stenosis.
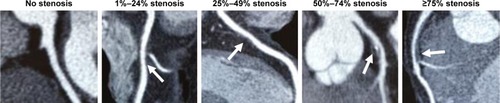
Figure 2 Longitudinal B-mode ultrasound image of the common carotid artery.
Abbreviation: IMT, intima–media thickness.
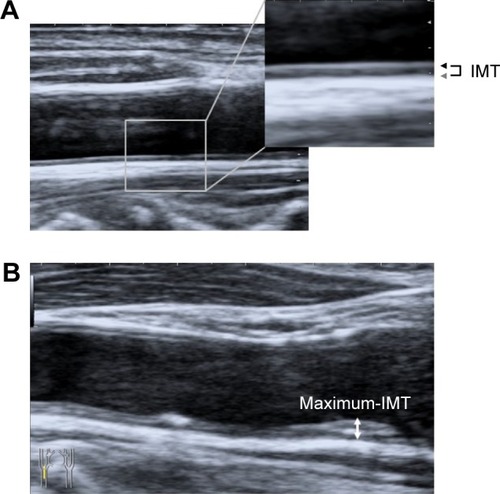
Figure 3 Flow diagram of the analyzed patients.
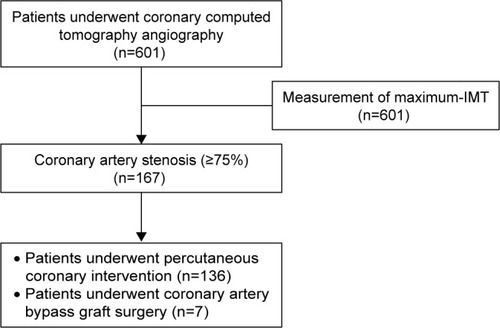
Table 1 Patients’ characteristics (n=601)
Table 2 Univariate and multivariate logistic regression analyses of the variables associated with the presence of coronary artery stenosis of ≥75% in all patients (n=167)
Figure 4 Associations between the degree of maximum-IMT and the prevalence of coronary artery stenosis (≥75%) as determined with coronary computed tomography angiography in each group categorized by the presence or absence of diabetes mellitus and renal impairment.
Abbreviation: IMT, intima–media thickness.
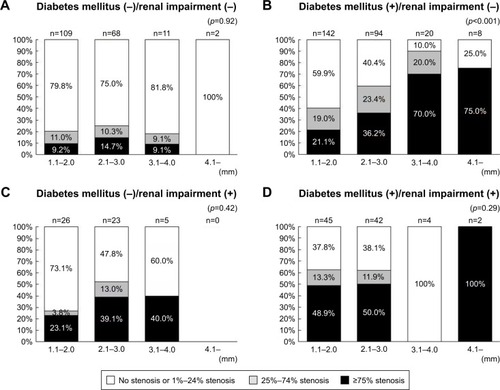
Table 3 Degree of maximum-IMT
Table 4 Patients’ characteristics categorized by the presence or absence of diabetes mellitus and renal impairment
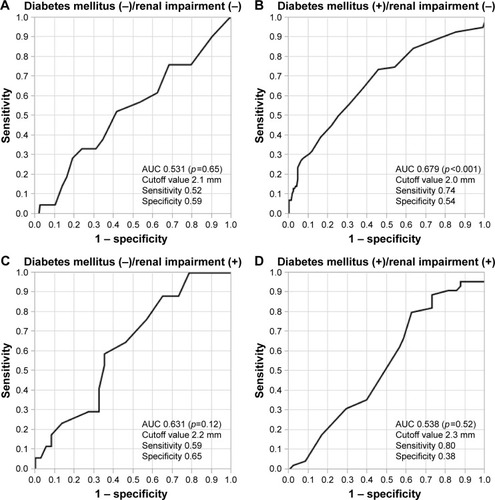
Figure 5 ROC analysis for predicting coronary artery stenosis of ≥75% for each group categorized by the presence or absence of diabetes mellitus and renal impairment.
Abbreviations: AUC, area under the curve; ROC, receiver operating characteristic.