
Figures & data
Figure 1 Flowchart displaying the participant’s screening, randomization, and treatment.
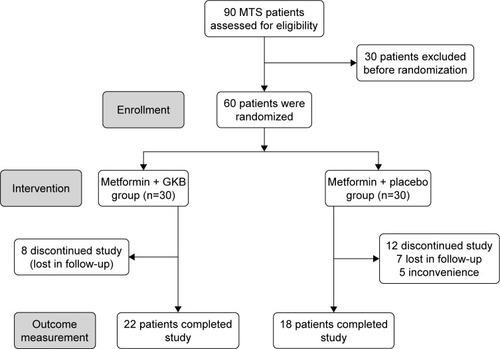
Table 1 Baseline characteristics of the randomly allocated MTS patients
Table 2 Glycemic control markers of metabolic syndrome patients maintained on Met and treated with GKB extract
Table 3 Changes in body weight and adiposity markers of metabolic syndrome patients maintained on Met and treated with GKB extract
Table 4 Changes in the lipid profile of metabolic syndrome patients maintained on Met and treated with GKB extract
Table 5 Changes in the inflammatory markers of metabolic syndrome patients maintained on Met and treated with GKB extract
Table 6 Changes in the liver and kidney function markers of metabolic syndrome patients maintained on Met and treated with GKB extract
Table 7 Changes in the hematological parameters of metabolic syndrome patients maintained on Met and treated with GKB extract