
Figures & data
Figure 1 PRISMA flow diagram of selected publications in systematic review and meta-analysis.
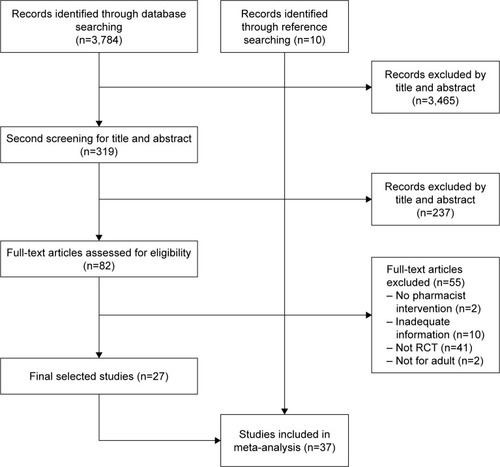
Table 1 Characteristics of randomized controlled studies included in the final analysis
Figure 2 The overall comparison of PC and UC on the improvement of HbA1C level changes.
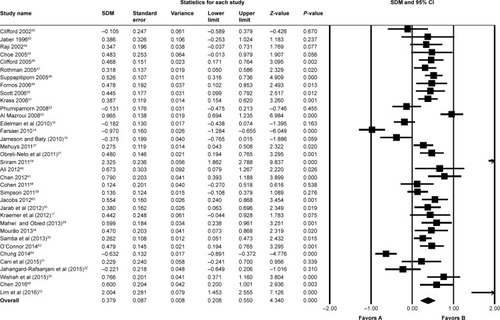
Figure 3 Meta-analysis of proportion of patients achieving target HbA1c levels between the PC and UC groups.
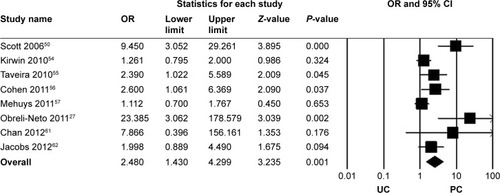
Figure 4 Effect of PC and UC in the improvement of HbA1C levels stratified by income level (A) and intervention period (B).
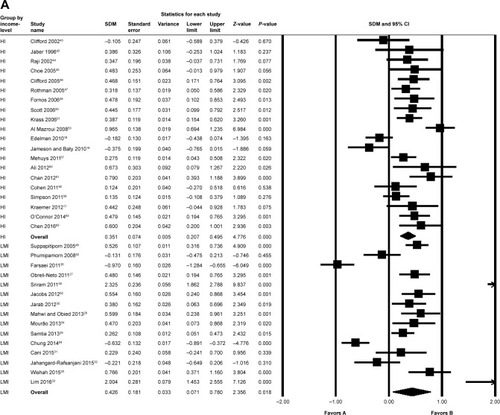
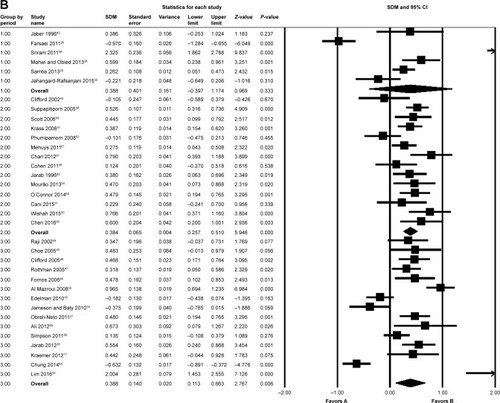
Figure S1 Publication bias visualized by funnel plot.
Abbreviation: SDM, standard difference in mean values.
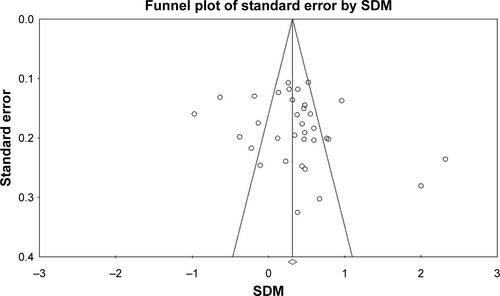
Table S1 The changes in HbA1C between PC group and UC group
Table S2 Proportion of patients achieving HbA1c goal between PC group and UC group
Table S3 Quality check for included studies (randomized controlled studies) by EPOC risk of bias