
Figures & data
Figure 1 Flow diagram of this study.
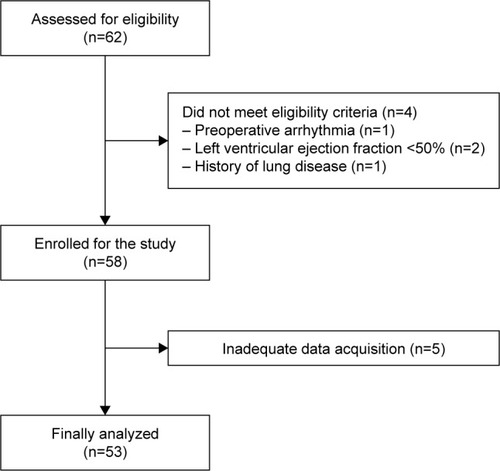
Table 1 Patient characteristics and perioperative details
Table 2 Hemodynamic variables and respiratory indices before and after fluid loading and changes in body position
Table 3 Hemodynamic variables before and after fluid loading in responders and non-responders placed in the supine position
Table 4 Hemodynamic variables before and after fluid loading in responders and non-responders placed in the prone position
Figure 2 Receiver operating characteristic curves, showing the ability of PPV (solid line) and PVI (dashed line) before volume loading to discriminate responders from non-responders.
Abbreviations: PPV, pulse pressure variation; PVI, pleth variability index.
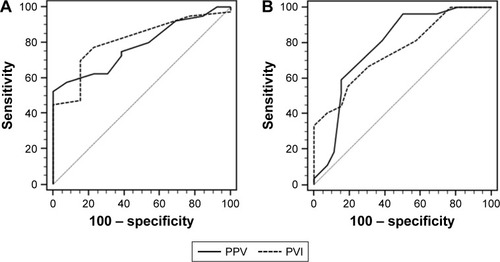
Table 5 Prediction of fluid responsiveness by receiver operating characteristic curves of pulse pressure variation and pleth variability index
Table 6 Characteristics of the studies that investigated the ability of dynamic indices to predict fluid responsiveness in patients undergoing spinal surgery in the prone position