Figures & data
Figure 1 The steps of the literature selection.
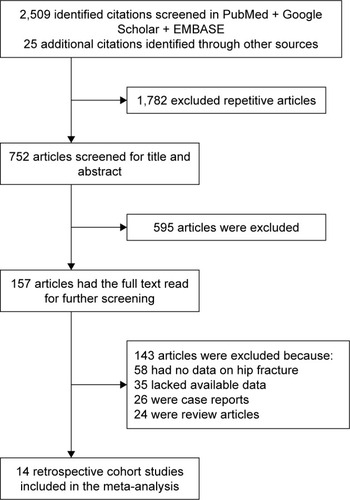
Table 1 Characteristics of 14 retrospective studies included in present meta-analysis
Figure 2 Proportions (%) of hip fracture in patients on dialysis or KT.
Note: Weights are from random effects analysis.
Abbreviations: HD, hemodialysis; KT, kidney transplantation; PD, peritoneal dialysis.
Abbreviations: HD, hemodialysis; KT, kidney transplantation; PD, peritoneal dialysis.
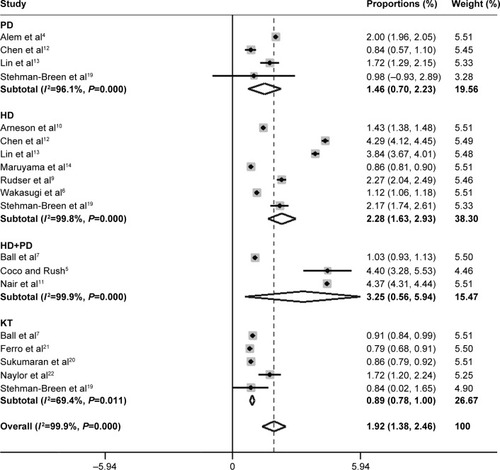
Figure 3 Incidence rate of hip fracture (per 1,000 person-years) in patients on dialysis or KT.
Note: Weights are from random effects analysis.
Abbreviations: HD, hemodialysis; KT, kidney transplantation; PD, peritoneal dialysis.
Abbreviations: HD, hemodialysis; KT, kidney transplantation; PD, peritoneal dialysis.
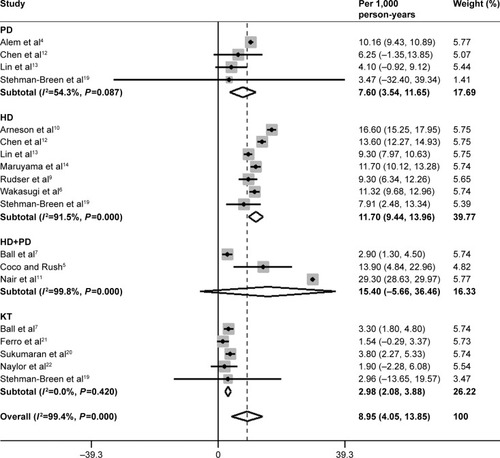
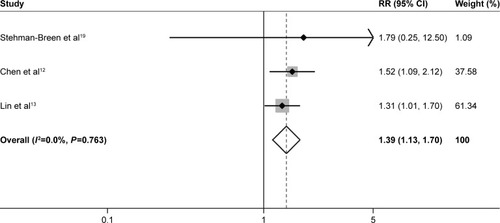
Figure 4 RR of hip fracture in patients on dialysis compared to the general population.
Note: Weights are from random effects analysis.
Abbreviation: RR, relative risk.
Abbreviation: RR, relative risk.
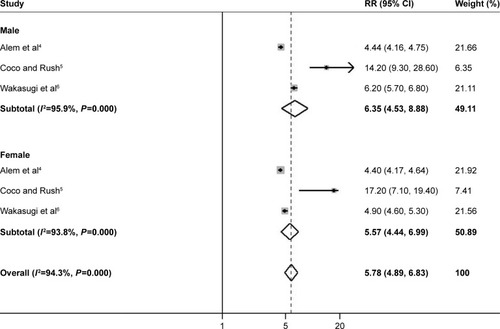
Figure 5 RR of hip fractures in patients on HD compared to those on PD.
Note: Weights are from random effects analysis.
Abbreviations: HD, hemodialysis; PD, peritoneal dialysis; RR, relative risk.
Abbreviations: HD, hemodialysis; PD, peritoneal dialysis; RR, relative risk.