Figures & data
Figure 1 Lung function and ACT scores.
Abbreviations: ACT, Asthma Control Test Questionnaire; FEV1, forced expiratory volume in the first second.
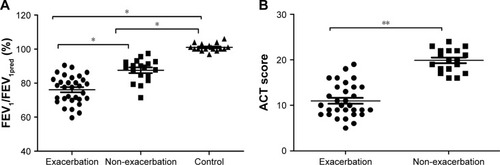
Table 1 Patient characteristics processed data
Figure 2 The cytokine levels in plasma.
Abbreviations: IFN-γ, interferon-γ; IL, interleukin.
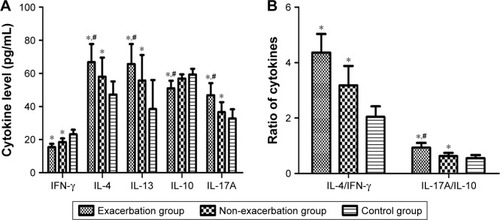
Figure 3 The transcription factor mRNA levels in plasma. (The mRNA level calculated here is relative to house-keeping gene expression.)
Abbreviations: Foxp3, forkhead/winged helix transcription factor 3; GATA-3, GATA binding protein 3; RORγt, retinoic acid–related orphan receptor gamma T; T-bet, T-box expressed in T cells.
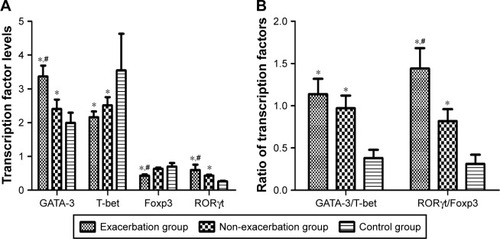
Figure 4 Spearman’s correlation analysis between Th17/Treg and Th2/Th1 homeostasis in asthmatic patients.
Abbreviations: Foxp3, forkhead/winged helix transcription factor 3; GATA-3, GATA binding protein 3; IFN-γ, interferon-γ; IL, interleukin; RORγt, retinoic acid–related orphan receptor gamma T; T-bet, T-box expressed in T cells.
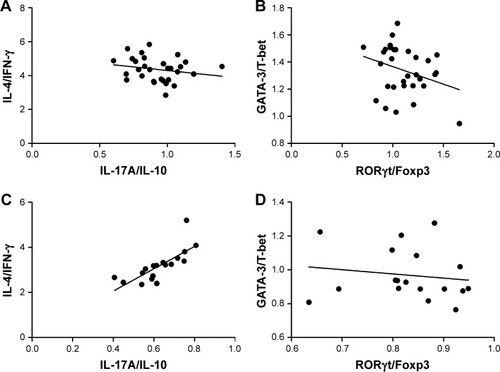
Figure 5 Spearman’s correlation analysis between cytokine expression ratios and disease severity in exacerbation group.
Abbreviations: ACT, Asthma Control Test Questionnaire; FEV1, forced expiratory volume in the first second; IFN-γ, interferon-γ; IL, interleukin.
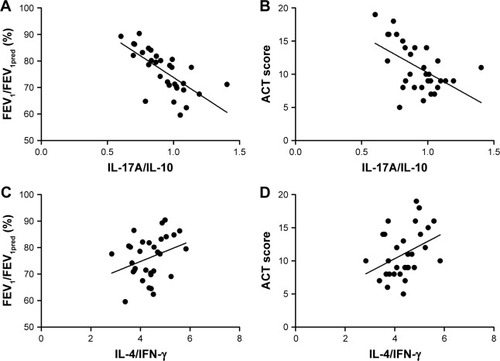
Figure 6 Spearman’s correlation analysis between cytokine expression ratios and disease severity in non-exacerbation group.
Abbreviations: ACT, Asthma Control Test Questionnaire; FEV1, forced expiratory volume in the first second; IFN-γ, interferon-γ; IL, interleukin.
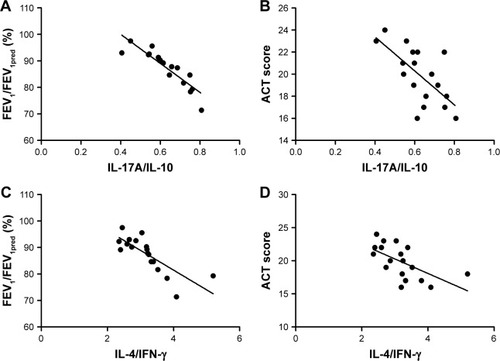
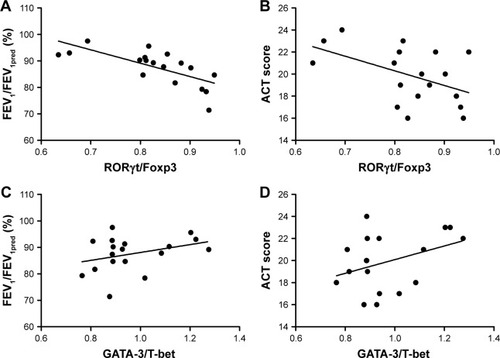
Figure 7 Spearman’s correlation analysis between transcription factor mRNA levels and disease severity in exacerbation group.
Abbreviations: ACT, Asthma Control Test Questionnaire; FEV1, forced expiratory volume in the first second; Foxp3, forkhead/winged helix transcription factor; GATA-3, GATA binding protein 3; RORγt, retinoic acid–related orphan receptor gamma T; T-bet, T-box expressed in T cells.
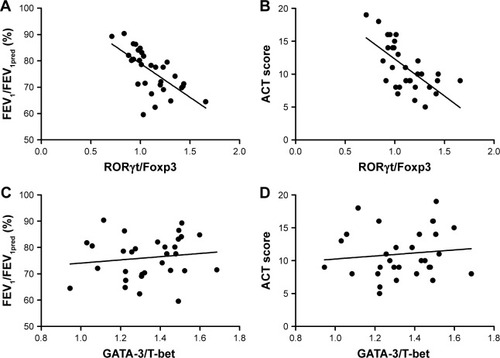
Figure 8 Spearman’s correlation analysis between transcription factor mRNA levels and disease severity in non-exacerbation group.
Abbreviations: ACT, Asthma Control Test Questionnaire; FEV1, forced expiratory volume in the first second; Foxp3, forkhead/winged helix transcription factor; GATA-3, GATA binding protein 3; RORγt, retinoic acid–related orphan receptor gamma T; T-bet, T-box expressed in T cells.