
Figures & data
Figure 1 Flow diagram of study searching and selection process.
Abbreviation: RCT, randomized controlled trial.
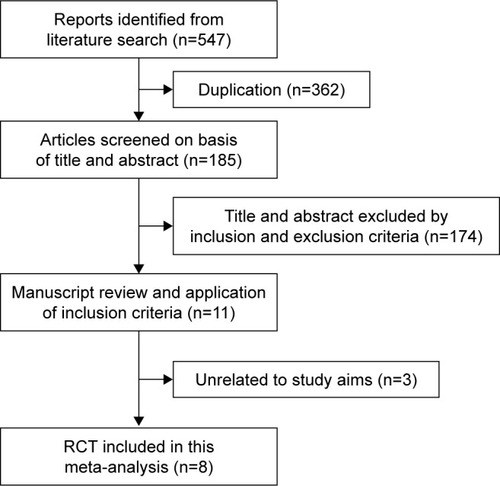
Table 1 The main characteristics of the studies included in the meta-analysis
Figure 2 Forest plot showing the odds ratios and 95% CIs of each study for hypoxemia.
Abbreviations: EGD, esophagogastroduodenoscopy; CFS, colonoscopy.
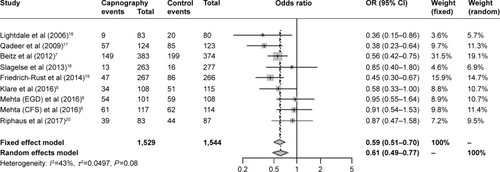
Figure 3 Forest plot showing the odds ratios and 95% CIs of each study for severe hypoxemia.
Abbreviations: EGD, esophagogastroduodenoscopy; CFS, colonoscopy.
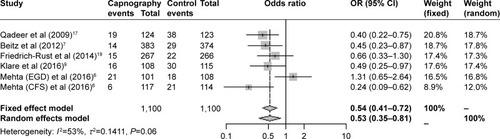
Figure 4 Forest plot showing the odds ratios and 95% CIs of each study for the incidence of apnea.
Abbreviations: EGD, esophagogastroduodenoscopy; CFS, colonoscopy.
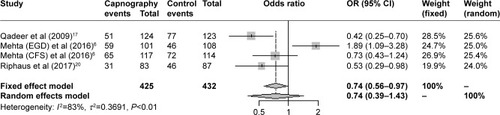
Figure 5 Forest plot showing the odds ratios and 95% CIs of each study for the detection of apnea.
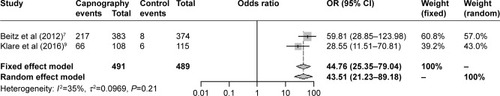
Table S1 Risk of bias summary
Table S2 GRADE approach Date: Question: Capnography monitoring compared to standard monitoring for gastrointestinal procedural sedation Setting: Bibliography: