
Figures & data
Table 1 Patients’ characteristics, compared to controls
Table 2 Patients’ characteristics, according to splenic status, genotype of the glucocerebrosidase gene, and specific bone parameters
Figure 1 Improvement of BMD under ERT in patients with Gaucher disease type 1.
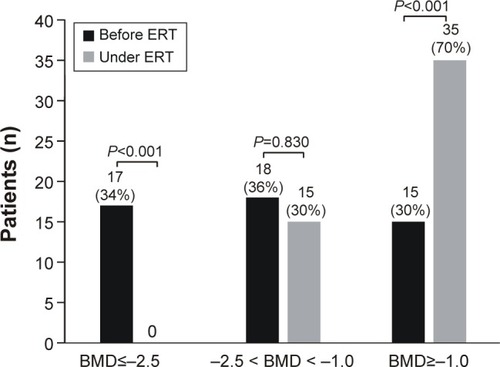
Table 3 Distribution of gene variants (alleles) with implications in bone metabolism in patients, stratified according to splenic status and controls
Table 4 Comparison between the bone densities (Z score) of patients before start of ERT (Z pre-ERT), at the moment of evaluation (Z under ERT), and the Z score increase under ERT (delta Z), depending on the analyzed gene variants of the osteoprotegerin, estrogen receptor 1, calcitonin receptor, and vitamin D receptor genes
Table 5 Distribution of the genotypes of the c.1024+283 G>A variant of VDR gene in patients with Gaucher disease, stratified according to BMD before ERT and to splenic status
Table 6 Biomarkers of bone metabolism and subclinical inflammation