
Figures & data
Figure 1 Flow diagram of patient enrolment.
Abbreviations: ACS, acute coronary syndrome; HDL-C, high-density lipoprotein-cholesterol; LDL-C, low-density lipoprotein-cholesterol; TC, total cholesterol; TG, triglycerides.
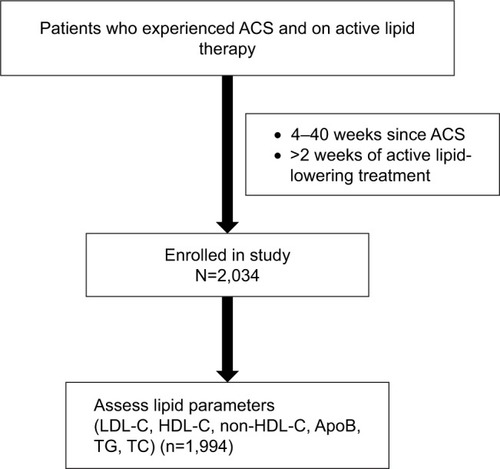
Table 1 Demographic and clinical characteristics of the index ACS event (eligible patients)
Figure 2 Sequential graph representing the lipid profiles of study population on different lipid-lowering therapies.
Note: (A) Lipid profile at the onset of index ACS and (B) at enrollment (1 mmol/L =38.61 g/dL).
Abbreviations: ACS, acute coronary syndrome; HDL-C, high-density lipoprotein-cholesterol; LDL-C, low-density lipoprotein-cholesterol; TC, total cholesterol; TG, triglycerides.
Abbreviations: ACS, acute coronary syndrome; HDL-C, high-density lipoprotein-cholesterol; LDL-C, low-density lipoprotein-cholesterol; TC, total cholesterol; TG, triglycerides.
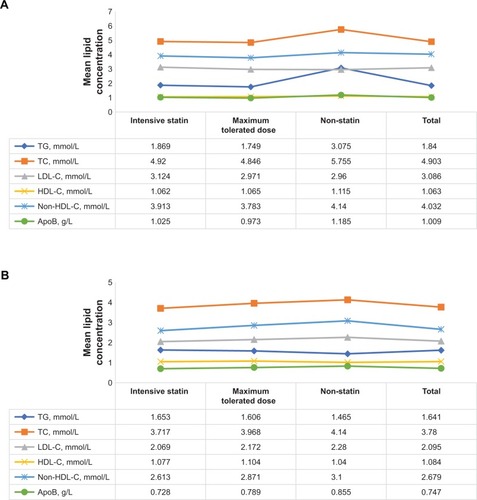
Figure 3 Sequential graph representing the lipid profiles of patients not achieving target lipid levels on different statin therapies.
Note: (A) Lipid profile at the onset of index ACS and (B) at enrollment (1 mmol/L =38.61 g/dL).
Abbreviations: ACS, acute coronary syndrome; HDL-C, high-density lipoprotein-cholesterol; LDL-C, low-density lipoprotein-cholesterol; TC, total cholesterol; TG, triglycerides.
Abbreviations: ACS, acute coronary syndrome; HDL-C, high-density lipoprotein-cholesterol; LDL-C, low-density lipoprotein-cholesterol; TC, total cholesterol; TG, triglycerides.
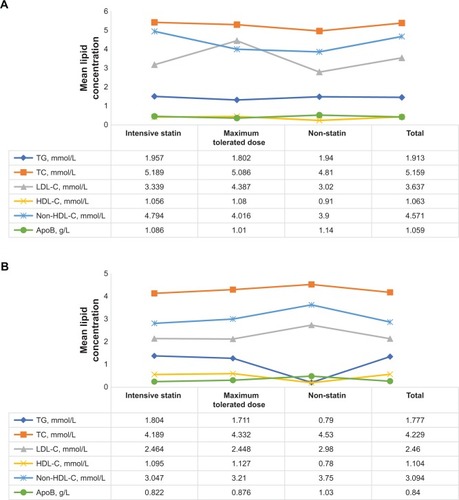
Table 2 Demographic and clinical characteristics of the index ACS event in patients not achieving lipid goal
Table S1 Ethics committees which provided approval