
Figures & data
Figure 1 The tachogram (A and F), traditional HRV spectrum (B and G), log–log plots of traditional HRV spectra (C and H), power-law function inside the traditional HRV spectra (D and I), and the residual HRV spectra (E and J) of a representative patient with PCA and a representative patient with AMI.
Notes: Both mean RRI and amplitude of RRI oscillation in the AMI patient (F) are smaller than those of the PCA patient (A). The powers in the HRV spectrum of the AMI patients (G) are also smaller than those of the PCA patient (I). The negative linear correlation between log (PSD) and log(Frq) in the HRV spectrum indicates that there is a power-law relation between PSD and Frq in the HRV spectra in both PCA and AMI patients. After removal of the power-law relation between PSD and Frq (D and I), the resultant rPSD (E and J) has relatively prominent HF component compared with the PSD in the traditional HRV spectra (B and G) in both PCA and AMI patients. The VLF and HF components in the rHRV spectrum of the AMI patient (J) are smaller than those of the PCA patient (E).
Abbreviations: AMI, acute myocardial infarction; Frq, frequency; HF, high frequency; HRV, heart rate variability; PCA, patent coronary artery; PSD, power spectral density; RRI, RR interval; VLF, very low frequency.
Abbreviations: AMI, acute myocardial infarction; Frq, frequency; HF, high frequency; HRV, heart rate variability; PCA, patent coronary artery; PSD, power spectral density; RRI, RR interval; VLF, very low frequency.
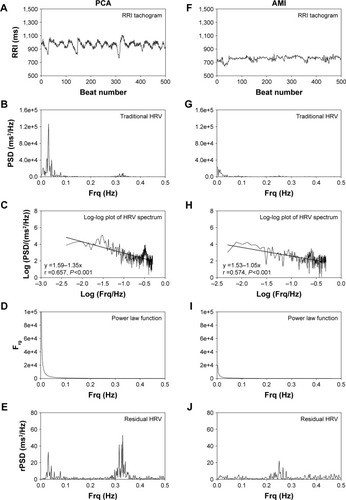
Table 1 Comparison of HRV and rHRV measures between patients with PCA and patients with AMI
Figure 2 The ROC curves with optimal cutpoints for those HRV and rHRV measures the AUC of which is >0.5 in predicting AMI.
Notes: (A) The high-risk patients with AMI are those whose TP <95.40 and rTP <0.96, with an AUC of 0.617 and 0.578, respectively. (B) The high-risk patients with AMI are those whose nHFP <40.43 and nrHFP <78, with an AUC of 0.612 and 0.627, respectively. (C) The high-risk patients with AMI are those whose nVLFP >42.14 and nrVLFP >7.18, with an AUC of 0.654 and 0.618, respectively. (D) The high-risk patients with AMI are those whose nHFP <40.43 + nVLFP >42.14 and nrHFP <78 + nrVLFP >7.18, with an AUC of 0.649 and 0.665, respectively. The nrHFP <78 + nrVLFP >7.18 is the most accurate diagnostic criteria for AMI, with an AUC of 0.665 (95% CI, 0.57–0.77; P=0.002) and accurate rate of 64.96%.
Abbreviations: AMI, acute myocardial infarction; AUC, area under the curve; HRV, heart rate variability; nHFP, normalized high-frequency power; nVLFP, normalized very low-frequency power; nrHFP, normalized residual high-frequency power; nrVFLP, normalized very low-frequency power; ROC, receiver operating characteristic; rTP, residual total power; TP, total power.
Abbreviations: AMI, acute myocardial infarction; AUC, area under the curve; HRV, heart rate variability; nHFP, normalized high-frequency power; nVLFP, normalized very low-frequency power; nrHFP, normalized residual high-frequency power; nrVFLP, normalized very low-frequency power; ROC, receiver operating characteristic; rTP, residual total power; TP, total power.
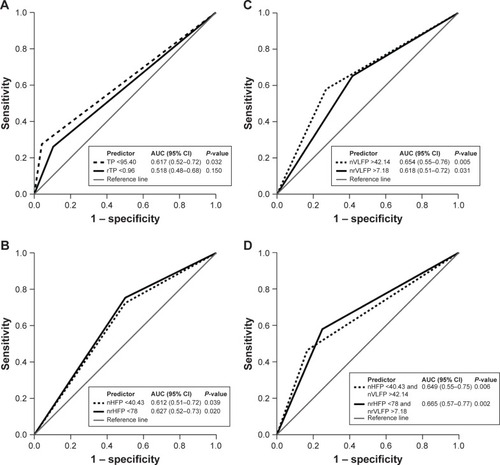
Table 2 The HRV and rHRV measures that have Youden’s cutpoints with an AUC >0.5 in predicting AMI