
Figures & data
Figure 1 Schematic presentation of the study.
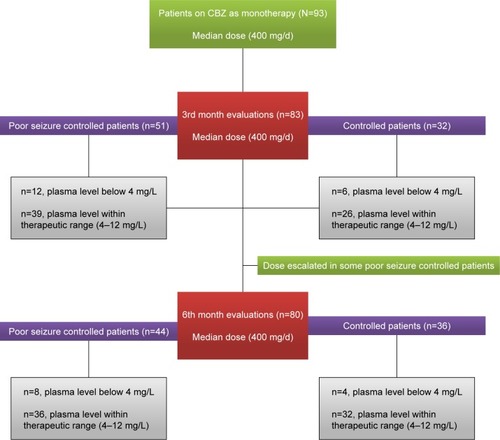
Figure 2 CONSORT diagram.
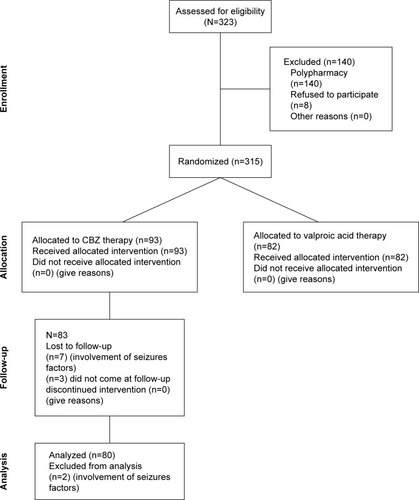
Table 1 Demographic features of the enrolled patients
Table 2 Dose and frequency of CBZ as monotherapy
Figure 3 Plasma level of CBZ vs different genotypes of SCN1A and SCN2A genes at the 3rd and 6th month of the therapy.
Abbreviation: CBZ, carbamazepine.
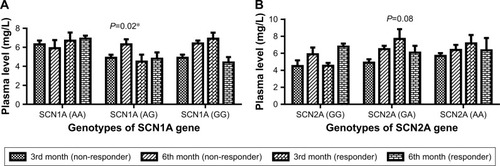
Table 3 Mean plasma levels of CBZ in patients with SCN (1A and 2A) gene polymorphisms with its relative frequencies in poor seizure-controlled and seizure-controlled patients at 3rd month of CBZ therapy
Figure 4 Duration of seizures per week in nonresponder patients to CBZ on 3rd and 6th month of the therapy.
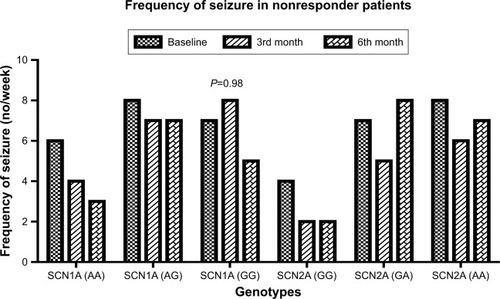
Table 4 Mean plasma level of CBZ in patients with SCN (1A and 2A) gene polymorphisms with its relative frequencies in poor seizure-controlled and seizure-controlled patients at 6th month of CBZ therapy