Figures & data
Figure 1 Screening of CTD-ILD patients.
Abbreviations: HRCT, high-resolution computed tomography; ILD, interstitial lung disease; CTD, connective tissue diseases.
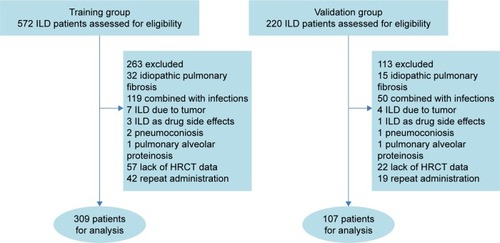
Figure 2 Feature selection.
Notes: (A) An example of manual delineation of primary lung lesions using CT image. The blue regions were the primary lung lesions manually delineated on the CT images by thoracic radiologists; The yellow region indicated the coordinates of the lesion regions; The number 2 indicated a total of 2 lesions for this patients. (B) Feature selection based on variance threshold <0.8. (C) Univariate analysis of the associations between the imaging phenotype and the treatment response. Twelve features with positive results are shown.
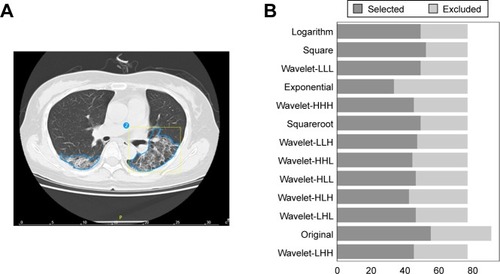
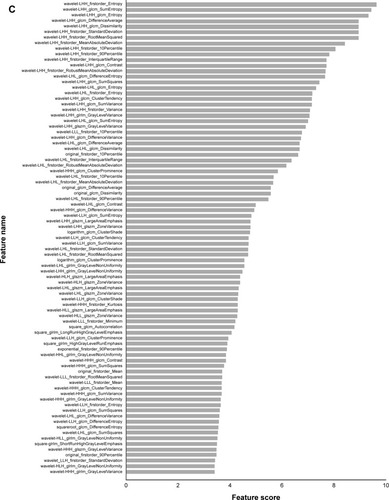
Table 1 Patient characteristics in the training and testing cohorts
Table 2 Characteristics of patients who responded or did not respond to treatment in the training and testing cohorts
Figure 3 Feature selection using the LASSO binary logistic model.
Notes: (A) Mean square error on each fold in fivefold cross-validation method. Vertical dotted line was drawn at the minimum mean square error of average. The optimal penalty parameter alpha was obtained based on the line. (B) LASSO coefficient solution path of the eleven features. A coefficient profile plot was produced according to the log (alpha) sequence. Vertical line was drawn at the value selected using fivefold cross-validation, where optimal alpha resulted in seven nonzero coefficients. (C) Coefficients in the LASSO model of the eleven features.
Abbreviation: LASSO, least absolute shrinkage and selection operator.
Abbreviation: LASSO, least absolute shrinkage and selection operator.
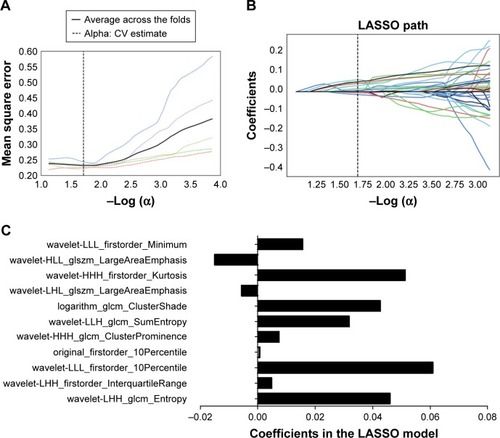
Table 3 LASSO coefficient profiles of the eleven features
Figure 4 ROC curves for machine learning of radiomics to predict treatment response.
Notes: ROC analysis of radiomics to predict treatment response by RF (A) and k-NN (B) models. ROC analysis of radiomics and clinical data to predict treatment response by RF (C) and k-NN (D) models.
Abbreviations: AUC, area under the curve; k-NN, k-nearest neighbors; RF, random forest; ROC, receiver-operating characteristic.
Abbreviations: AUC, area under the curve; k-NN, k-nearest neighbors; RF, random forest; ROC, receiver-operating characteristic.
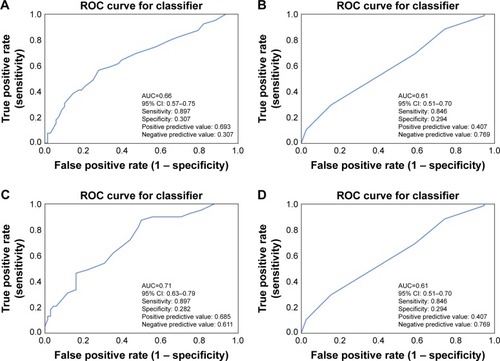
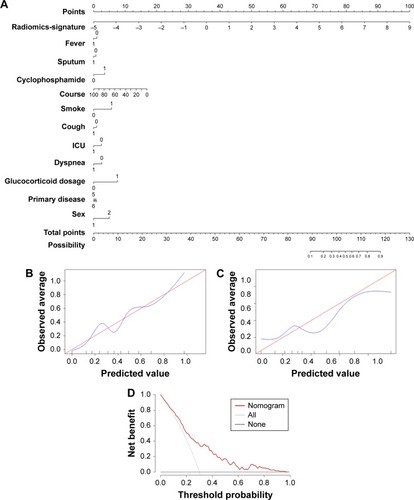
Figure 5 Developed radiomics nomogram.
Notes: (A) The radiomics nomogram was developed in the training group with the radiomics signature and clinical data to predict treatment response. (B) Calibration curves of the radiomics and clinical data nomogram in the training group. (C) Calibration curve of the radiomics and clinical data nomogram in the validation group. (D) Decision curve analysis for the radiomics and clinical data nomogram. The y-axis measures the net benefit. The gray line represents the assumption that all patients respond to treatment. Black line represents the assumption that no patients respond to glucocorticoid. The net benefit was calculated by subtracting the proportion of all false-positive patients from the true-positive proportion, weighting by the relative harm of forgoing treatment compared with the negative consequences of an unnecessary treatment.
Abbreviation: ICU, intensive care unit.
Abbreviation: ICU, intensive care unit.