Figures & data
Figure 1 Eligibility of studies for inclusion in meta-analysis.
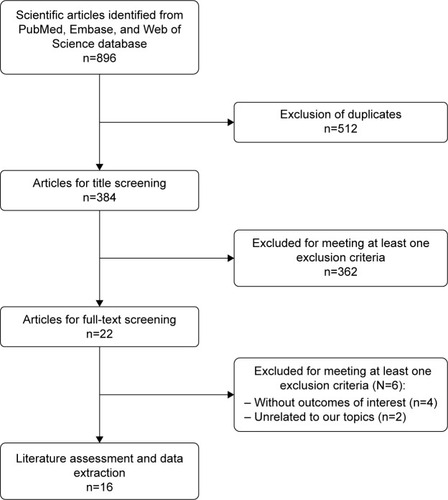
Table 1 Baseline characteristics of patients in trials included
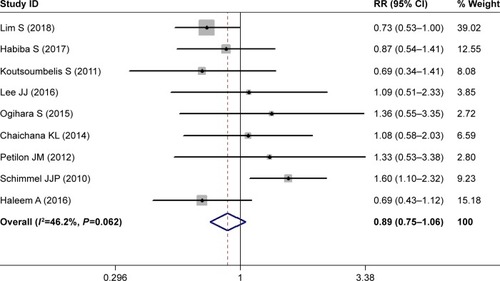
Figure 2 Forest plot showing the relationship between male sex and postoperative surgical site infection.
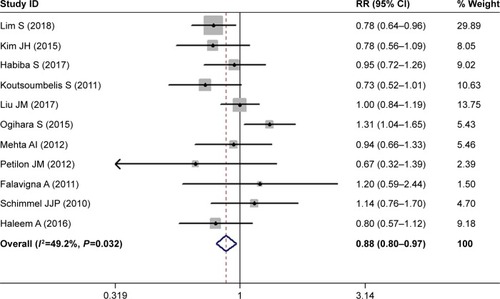
Table 2 Pooled estimates of RR (WMD)Table Footnotea obtained from meta-analysis of risk factors of SSI following lumbar spine surgery
Figure 3 Forest plot showing relationship between increased age and postoperative surgical site infection.
Note: Weights are from random-effects analysis.
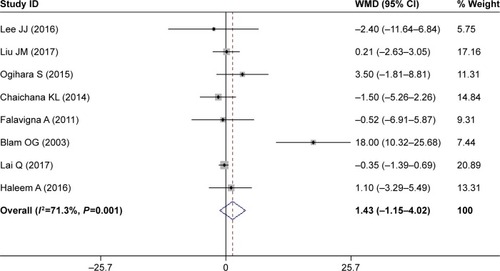
Figure 4 Forest plot showing the relationship between diabetes and postoperative surgical site infection.
Note: Weights are from random-effects analysis.
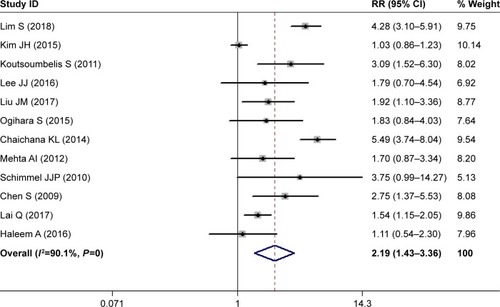
Figure 5 Forest plot showing the relationship between current smoking and postoperative surgical site infection.