
Figures & data
Figure 1 Percentages of patients according to the length of intubation after CABG.
Abbreviation: CABG, coronary artery bypass grafting.
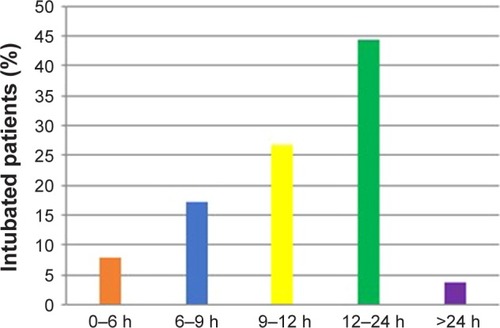
Table 1 Study group characteristics and perioperative data for each intubation time cohort
Table 2 Primary and secondary outcomes data for each intubation time cohort
Table 3 Differences in 30-day mortality for different intubation time-points
Table 4 Baseline characteristics and perioperative data for patients intubated for ≤12 hours and >12 hours during and after CABG
Table 5 Postoperative complications and mortality for patients intubated ≤12 and >12 hours
Table 6 Univariate and multivariate analysis for intubation longer than 12 hours after CABG