Figures & data
Table 1 Patient characteristics at baseline
Figure 1 Percent changes of serum albumin-corrected calcium (Ca) (A), serum phosphorus (B), whole parathyroid hormone (PTH) (C), and serum 1,25(OH)2D3 (D) at 12, 24, and 36 months (M). Circles show the denosumab group and triangles show the combination group.
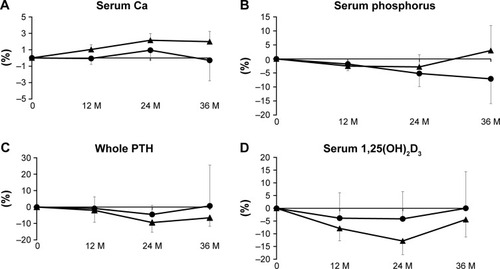
Figure 2 Percent changes of serum zinc (A), serum iron (B), and serum magnesium (C) at 12, 24, and 36 months (M).
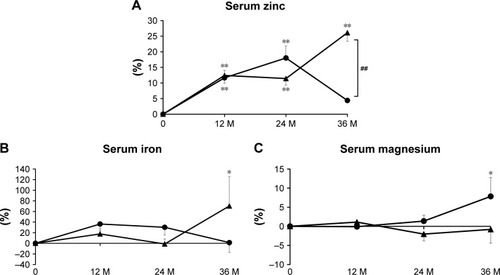
Figure 3 Percent changes of serum tartrate-resistant acid phosphatase (TRACP)-5b (A), urinary cross-linked N-terminal telopeptide of type I collagen (NTX) (B), serum bone alkaline phosphatase (BAP) (C), and serum 25-hydroxyvitamin D (25(OH)D) (D) at 12, 24, and 36 months (M). Circles show the denosumab group and triangles show the combination group.
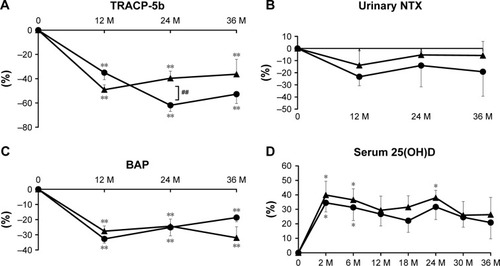
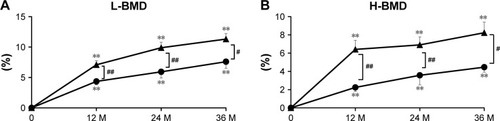
Figure 4 Percent changes in lumbar bone mineral density (L-BMD) (A) and bilateral total hip BMD (H-BMD) (B) at 12, 24, and 36 months (M).