
Figures & data
Table 1 Demographics and health/disease history differences across line of therapy among patients with ED-SCLC (N=5,849)
Figure 1 Regional treatment pattern differences for ED-SCLC.
Abbreviations: 1L, first-line; 2L, second-line; 3L, third-line; ED-SCLC, extensive disease small-cell lung cancer.
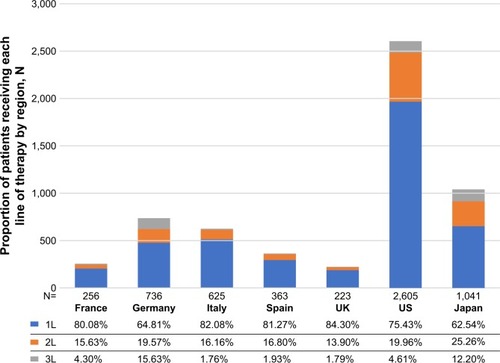
Figure 2 Real-world treatment patterns for ED-SCLC.
Abbreviations: 1L, first-line; 2L, second-line; ED-SCLC, extensive disease small-cell lung cancer; EU5, European Union 5 (France, Germany, Italy, Spain, and the UK).
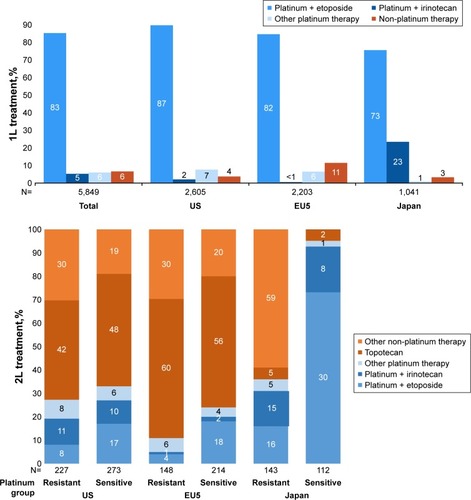
Figure 3 Real-world platinum resistance/sensitivity.
Abbreviations: 1L, first-line; EU5, European Union 5 (France, Germany, Italy, Spain, and the UK).
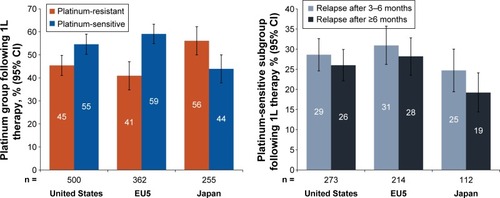
Table 2 Differences in 1L treatment patterns across regions among patients with ED-SCLC (N=5,849)
Table 3 Prevalence of 1L platinum sensitivity across country among patients with ED-SCLC who used platinum therapy in 1L (N=1,117)
Table 4 Differences in 2L treatment patterns across region and across platinum sensitivity among patients with ED-SCLC who used a platinum-based 1L therapy (N=1,117)