
Figures & data
Table 1 Characteristics of the study population
Figure 1 estimated clearance according to the CYP3A5 genotypes of the recipient and donor.
Notes: (A) On the first day after transplantation. (B) From day 1 to 14.
Abbreviations: POD, postoperative day; REDE, CYP3A5 expresser recipient and expresser donor; REDN, expresser recipient and nonexpresser donor; RNDE, nonexpresser recipient and expresser donor; RNDN, nonexpresser recipient and nonexpresser donor.
Abbreviations: POD, postoperative day; REDE, CYP3A5 expresser recipient and expresser donor; REDN, expresser recipient and nonexpresser donor; RNDE, nonexpresser recipient and expresser donor; RNDN, nonexpresser recipient and nonexpresser donor.
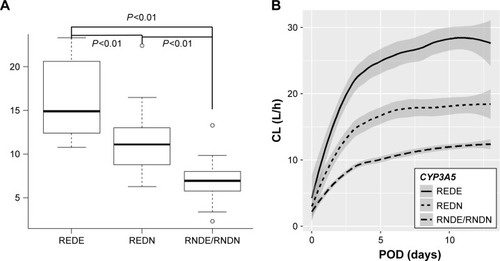
Figure 2 estimated volume of distribution from day 1 to 14.
Abbreviation: POD, postoperative day.
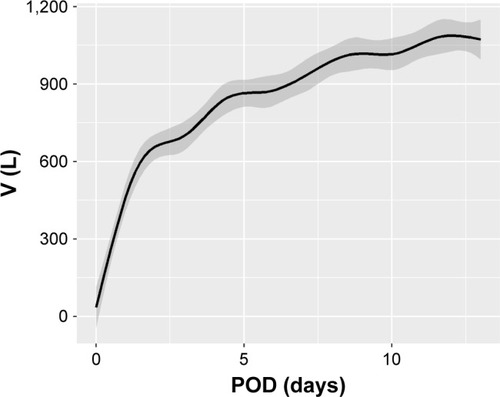
Table 2 Population pharmacokinetic parameters
Figure 3 Goodness-of-fit plot.
Notes: (A) Observed vs IPRED of the base model. (B) Observed vs IPRED of the final model. (C) PRED vs CWRES. (D) Time vs CWRES.
Abbreviations: CWRES, conditional-weighted residuals; IPRED, individual predictive value; PRED, predictive value.
Abbreviations: CWRES, conditional-weighted residuals; IPRED, individual predictive value; PRED, predictive value.
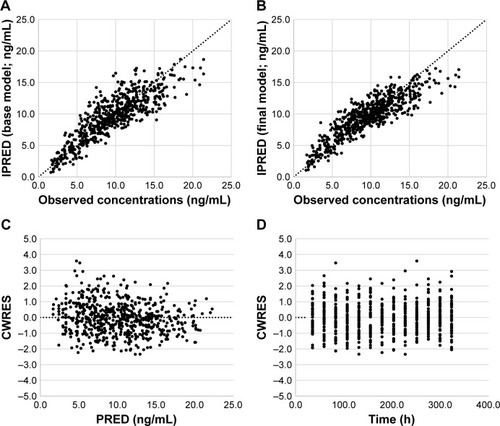
Figure 4 Visual predictive check plot.
Notes: The observed concentrations are shown as circles. The solid line and two dashed lines represent the 50th, 5th, and 95th percentiles of the observations. The red shaded area represents 90% CI of the simulation median, whereas the blue shaded areas represent 90% CI of the simulation 5th and 95th percentiles.
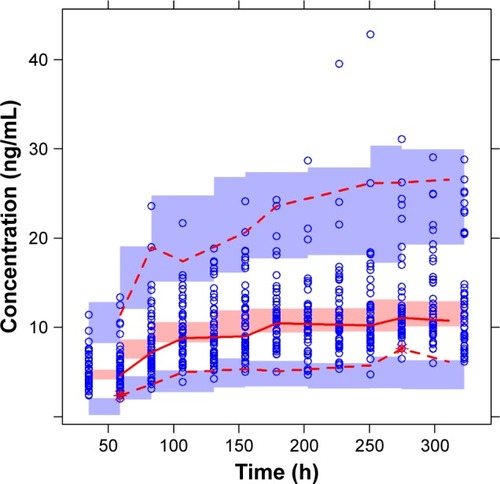
Table 3 Dosage suggestion in mg for tacrolimus from POD 1 to 14