Figures & data
Figure 1 Flowchart of the study selection process.
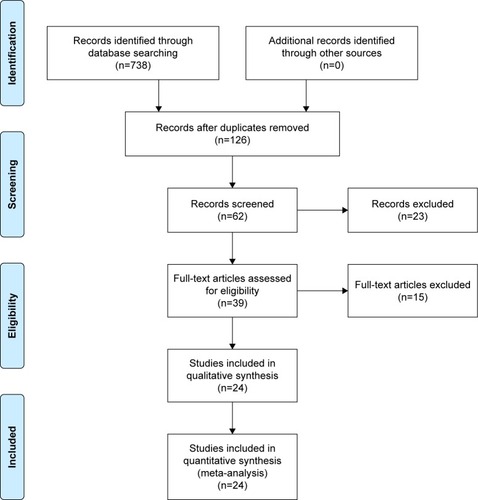
Table 1 Characteristics of included studies
Figure 2 Forest plot showing blood loss.
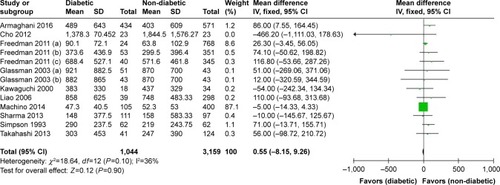
Figure 3 Forest plot showing operation time.
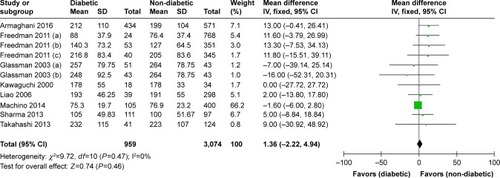
Figure 4 Forest plot showing length of hospital stay.
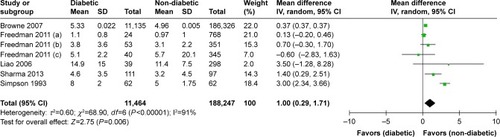
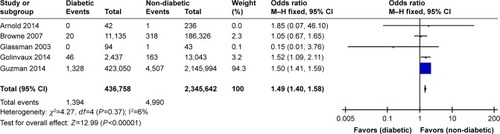
Figure 5 Forest plot showing mortality.
Abbreviation: M–H, Mantel–Haenszel.
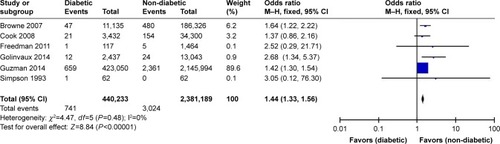
Figure 6 Forest plot showing reoperation.
Abbreviation: M–H, Mantel–Haenszel.
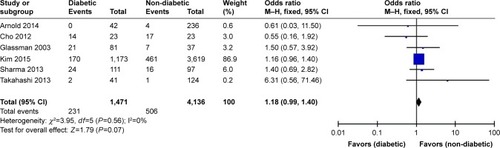
Figure 7 Forest plot showing infection.
Abbreviation: M–H, Mantel–Haenszel.
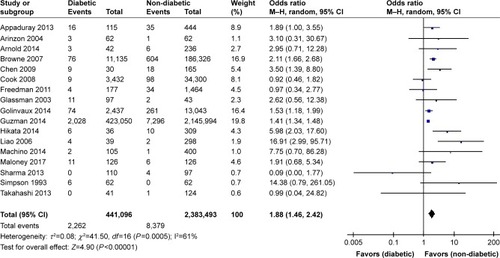
Figure 8 Forest plot showing deep venous thrombosis.
Abbreviation: M–H, Mantel–Haenszel.