
Figures & data
Figure 1 The clinical trial flow chart.
Abbreviations: BMI, body mass index; FPG, fasting plasma glucose; HbA1c, glycosylated hemoglobin; PPG, postprandial plasma glucose; SUA, serum uric acid; T2DM, type 2 diabetes mellitus.
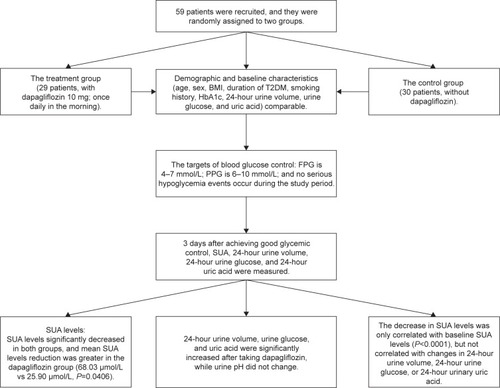
Table 1 Demographic and baseline characteristics
Table 2 Changes in FPG, PPG, and SUA levels before and after treatment in the two groups
Table 3 Comparisons of changes in FPG, PPG, and SUA levels between the dapagliflozin group and the control group
Table 4 Comparisons of adjusted mean SUA levels between the dapagliflozin group and the control group
Table 5 Changes in urinary parameters before and after treatment in the dapagliflozin group
Table 6 Pearson correlation analysis between changes in SUA levels and baseline SUA levels, changes in 24-hour urine volume, 24-hour urine glucose, or 24-hour urinary uric acid
Table 7 Linear regression between changes in SUA levels and baseline SUA levels