
Figures & data
Figure 1 Flow diagram for the study enrollment and completion for CAPD patients.
Abbreviation: CAPD, continuous ambulatory peritoneal dialysis.
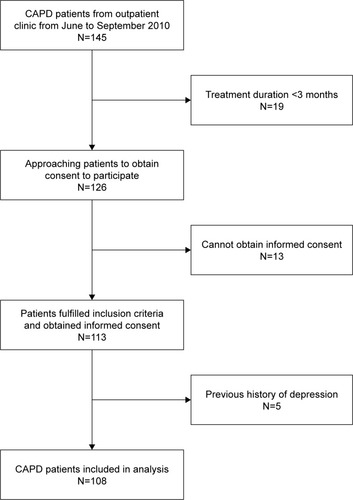
Table 1 Demographics and clinical characteristics of 108 patients with end-stage renal disease treated with continuous ambulatory peritoneal dialysis
Table 2 Univariable logistic regression analysis of potential risk factors for depression in patients with end-stage renal disease treated with continuous ambulatory peritoneal dialysis
Table 3 Multivariable logistic regression analysis of potential risk factors for depression in patients with end-stage renal disease treated with continuous ambulatory peritoneal dialysis