Figures & data
Figure 1 The time-concentration curves (left) and schematic diagram of the Patlak model (right).
Abbreviations: Ktrans, volume transfer constant; Vp, fractional plasma volume.
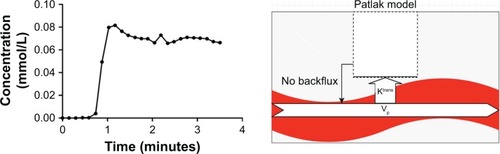
Figure 2 The representative images of dynamic contrast-enhanced magnetic resonance imaging with Patlak model.
Notes: A 24-year-old patient with RRMS. (A) Precontrast T1-weighted: round low signal in the left periventricular areas (arrow). (B) Dynamic contrast-enhanced T1-weighted images: the lesion was enhanced in T1-weighted contrast-enhanced sequences (arrow). (C) Ktrans map. (D) Vp map. (E) CBF map. (F) CBV map. ROI 1 located in CE lesions (Circle 1), ROI 2 located in the NAWM regions close to the lesions (Circle 2), ROI 3 located in the NAWM regions far from the lesions (Circle 3). For the color maps (C–F), red color represents a high value, blue color represents a low value.
Abbreviations: CBF, cerebral blood flow; CBV, cerebral blood volume; Ktrans, volume transfer constant; NAWM, normal-appearing white matter; ROI, region of interest; RRMS, relapsing–remitting multiple sclerosis; Vp, fractional plasma volume.
Abbreviations: CBF, cerebral blood flow; CBV, cerebral blood volume; Ktrans, volume transfer constant; NAWM, normal-appearing white matter; ROI, region of interest; RRMS, relapsing–remitting multiple sclerosis; Vp, fractional plasma volume.
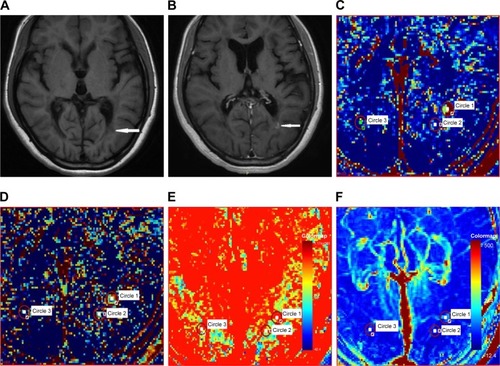
Table 1 The permeability and perfusion characteristic of MS lesions and NAWM regions
Table 2 The histogram parameters of MS lesions
Figure 3 The histogram of Ktrans in CE lesions (A) and NE lesions (B).
Note: The skewness of Ktrans in CE lesions increased to the right side of histogram, while the histogram of Ktrans in NE lesions was more close to normal distribution.
Abbreviations: CE, contrast-enhancing; Ktrans, volume transfer constant; NE, non-enhancing.
Abbreviations: CE, contrast-enhancing; Ktrans, volume transfer constant; NE, non-enhancing.
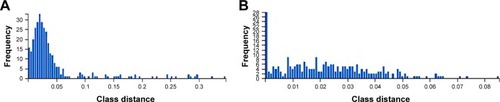
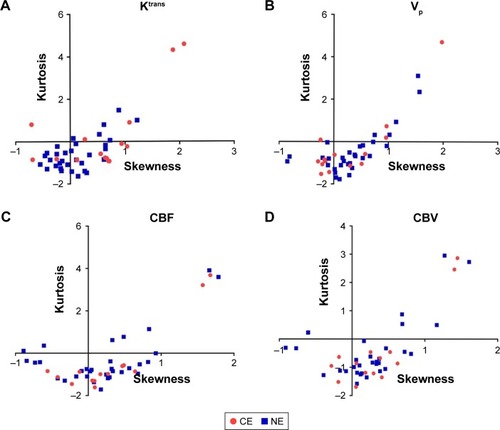
Figure 4 The skewness and kurtosis of different parameters.
Note: The skewness and kurtosis of Ktrans in CE lesions were significantly higher than NE lesions (A), while no significant differences were found in terms of Vp, CBF, and CBV (B–D).
Abbreviations: CBF, cerebral blood flow; CE, contrast-enhancing; CBV, cerebral blood volume; Ktrans, volume transfer constant; NE, non-enhancing; Vp, fractional plasma volume.
Abbreviations: CBF, cerebral blood flow; CE, contrast-enhancing; CBV, cerebral blood volume; Ktrans, volume transfer constant; NE, non-enhancing; Vp, fractional plasma volume.