Figures & data
Figure 1 The flow diagram of literature search and selection.
Abbreviation: RCT, randomized controlled trial.
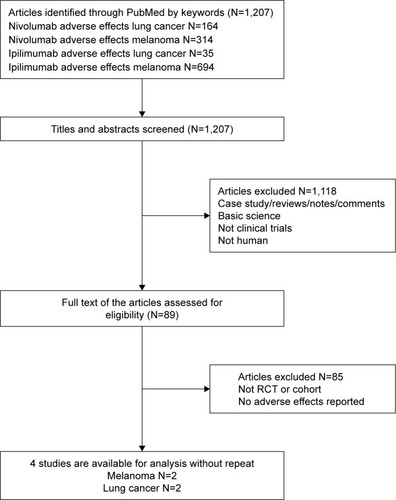
Table 1 Characteristics of studies including nivolumab-plus-ipilimumab and nivolumab therapy
Table 2 Incidence and OR of irAEs, including 95% CI and number of trials in each analysis
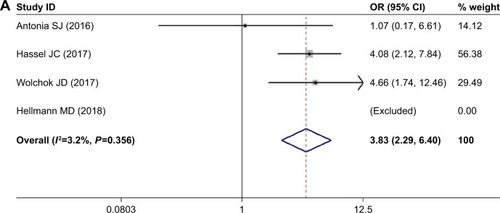
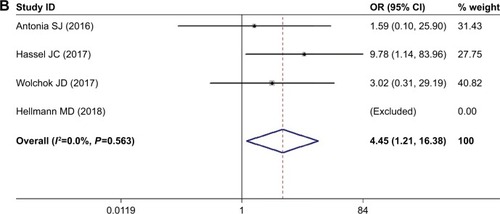
Figure 2 Meta-analysis of the risk of pruritus.
Notes: (A) Forest plot of the risk of all-grade pruritus. (B) Forest plot of the risk of high-grade pruritus.
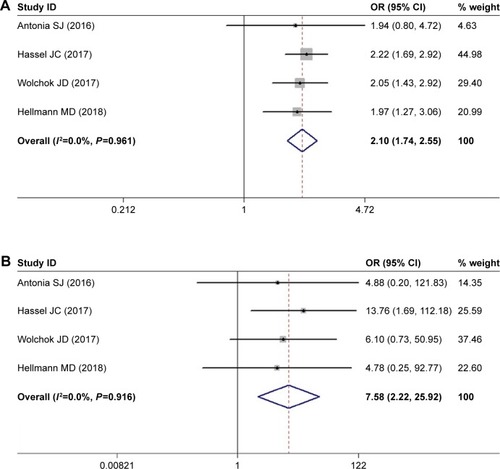
Figure 3 Meta-analysis of the risk of rash.
Notes: (A) Forest plot of the risk of all-grade rash. (B) Forest plot of the risk of high-grade rash. Weights are from random-effects analysis.
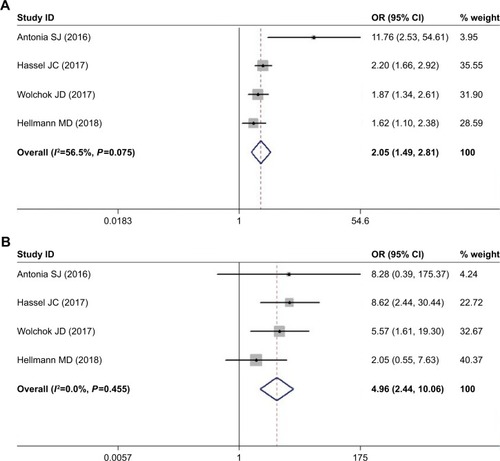
Figure 4 Meta-analysis of the risk of diarrhea.
Notes: (A) Forest plot of the risk of all-grade diarrhea. (B) Forest plot of the risk of high-grade diarrhea. Weights are from random-effects analysis.
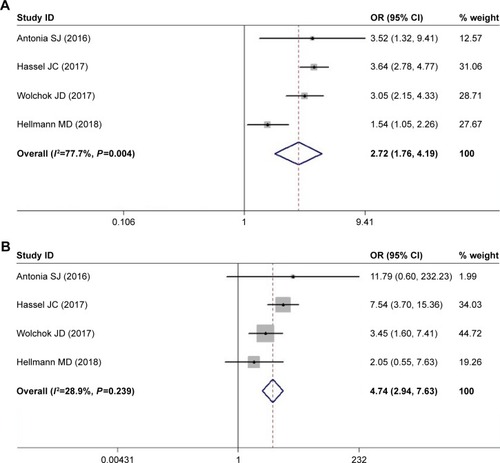
Figure 5 Meta-analysis of the risk of colitis.
Notes: (A) Forest plot of the risk of all-grade colitis. (B) Forest plot of the risk of high-grade colitis.
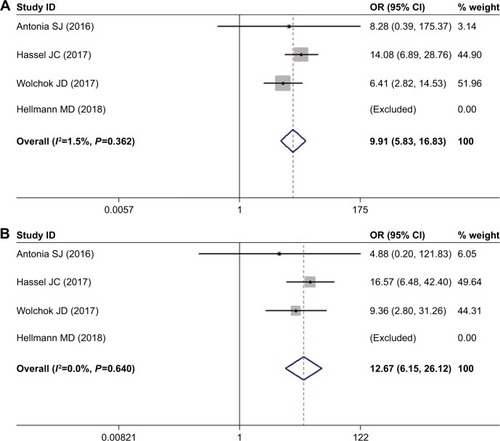
Figure 6 Meta-analysis of the risk of ALT elevation.
Notes: (A) Forest plot of the risk of all-grade ALT elevation. (B) Forest plot of the risk of high-grade ALT elevation.
Abbreviation: ALT, alanine aminotransferase.
Abbreviation: ALT, alanine aminotransferase.
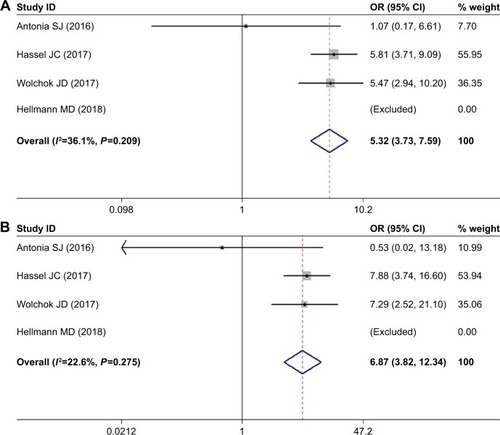
Figure 7 Meta-analysis of the risk of pneumonitis.
Notes: (A) Forest plot of the risk of all-grade pneumonitis. (B) Forest plot of the risk of high-grade pneumonitis.