
Figures & data
Figure 1 Flow diagram of case enrollment in this study. A total of 15,069 patients with index ED visits were registered and followed-up for unscheduled admissions to Showa University Hospital within 7 days after discharge. Among the 11,669 discharged patients, 180 had bounce-back admissions within 3 days (3d-BBAs), and 257 had 7-day bounce-back admissions (7d-BBAs).
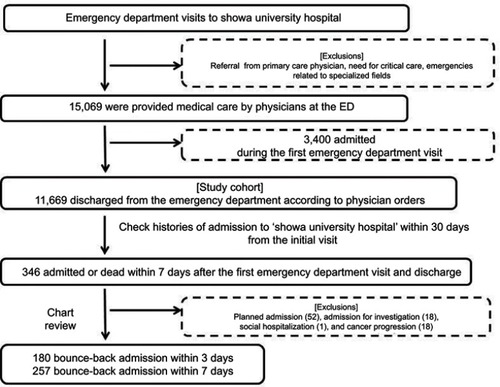
Figure 2 Distribution of time from ED discharge to unscheduled admission (n=257). In 7d-BBA cases, the median time from ED discharge to unscheduled admission was 2 days.
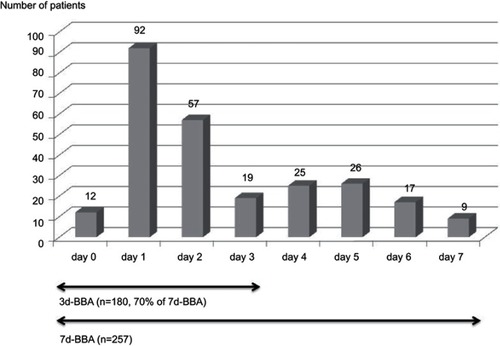
Table 1 Detailed list of diagnoses in 7-day bounce-back admission cases (n=257)
Figure 3 Length of hospitalization comparison and period from index visit to discharge in admitted cases with the same diagnosis and 7d-BBA. There was no significant difference in length of hospitalization and period from index visit to discharge except for those with pneumonia or exacerbation of COPD/asthma.
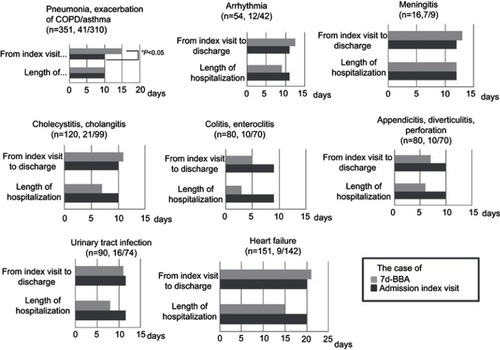
Figure 4 Comparison of diagnoses upon discharge and admittance in 7-day bounce-back admission cases. Discharge and admission diagnoses were similar in 117 (46%), different in 110 (43%), and unclear in 30 (12%) cases. The most common diagnoses on admittance in the “similar” cases were pneumonia, exacerbation of chronic obstructive pulmonary disease, and/or bronchial asthma, whereas those in “different” cases were acute cholangitis or cholecystitis.
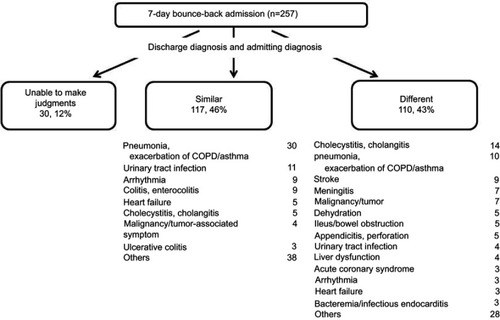
Figure 5 Transitional changes of number of patients per month, and the distribution of discharged, admitted and frequency of 7d-BBA patients (n=15,069). * Changes in staff temporarily dispatched from other departments.
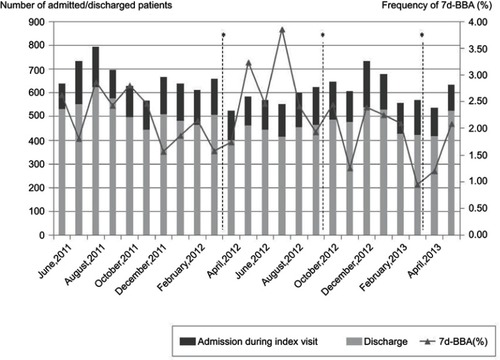
Table 2 Each disease, stratified by age groups (18–39, 40–59, 60–79, over 80) and comparing the period from index visit to discharge and the length of hospitalization in the 7d-BBA group and the admission on index visit group
Table 3 Comparison of BBA distributions when admission and discharge diagnoses were known (n=227)
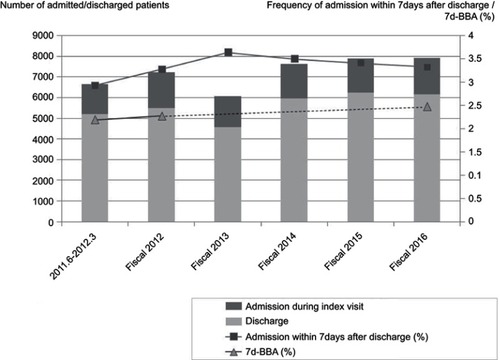
Figure 6 Transitional changes in the number of patients per year, and the distribution of discharged, admitted, frequency of admission within 7 days after discharge, and 7d-BBA patients. For the period from 2013 to 2015, we counted only the cases of admission within 7 days after discharge. The frequencies of admission within 7 days after discharge were 3.33–3.64%. The frequency of 7d-BBA in the fiscal period 2016 was 2.48% (153/6165).
Data availability
The availability of data used in this study is restricted by the ethical committee on human studies of Showa University in order to protect patient privacy. Data are available from Yoko Tarumi ([email protected]) for researchers who meet criteria for access to confidential data and upon reasonable request.