
Figures & data
Figure 1 Distribution of BIS scores of each groups. The y-axis presents BIS level and the x-axis presents the number of patients.
Abbreviation: BIS, bispectral index.
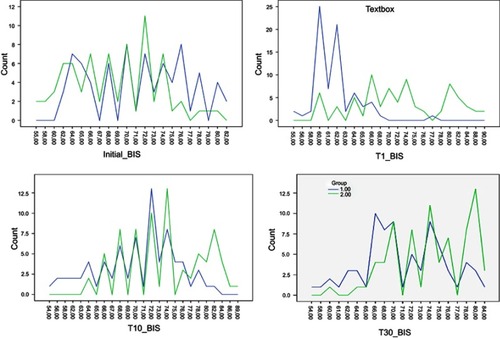
Figure 2 Facial pain score.
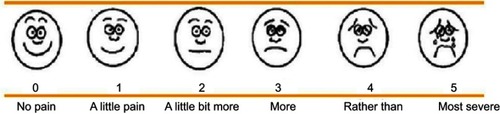
Table 1 Demographic characteristics and duration of the procedures
Table 2 Diagnosis of the patients
Table 3 Time-dependent changes in circulatory dynamics, Categorical BIS scores, distribution, and differences between patient groups*
Figure 3 Distribution of facial pain scores of each group.
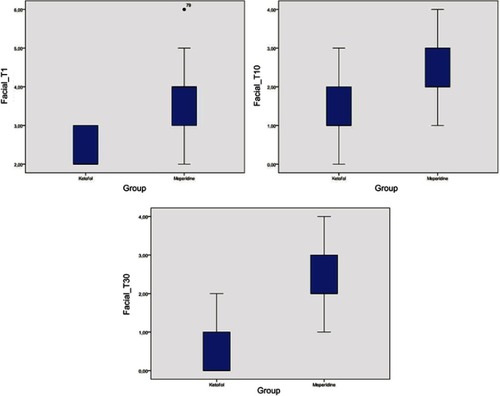
Table 4 Ramsay sedation scale
Table 5 Time to achieve RSS, MAS, and total dose of rescue medication
Table 6 Sedation related complications during the procedure and the recovery