
Figures & data
Table 1 Characteristics of patients
Figure 1 Kaplan-Meier analysis of the time to the first postsurgical seizure in the population overall (A) and by FCD types (B). The P-value was calculated from a log-rank test.
Abbreviation: FCD, focal cortical dysplasia.
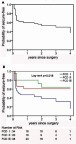
Table 2 Univariable analysis of risk factors for postoperative seizure
Table 3 Multivariable analysis of risk factors for postoperative seizure