
Figures & data
Figure 1 Summary of patient treatment protocol.
Abbreviations: BPPV, benign paroxysmal positional vertigo; PRMs, particle repositioning maneuvers.
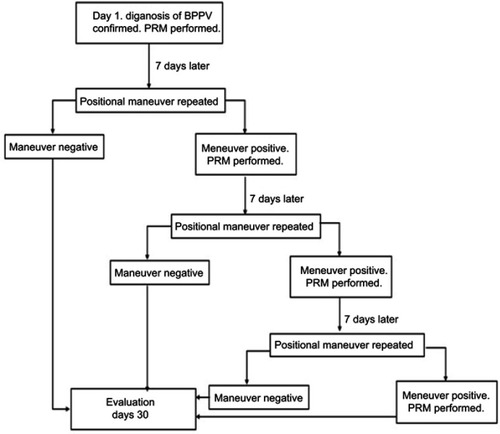
Table 1 The success rates and recurrence according to the types of BPPV (n=359)
Figure 2 Benign paroxsymal positional vertigo (BPPV) distribution.
Abbreviations: PSC, posterior semicircular canal; G-HSC, geotropic horizontal semicircular canal; Ag-HSC, apogeotropic horizontal semicircular canal; ASC, anterior semicircular canal.
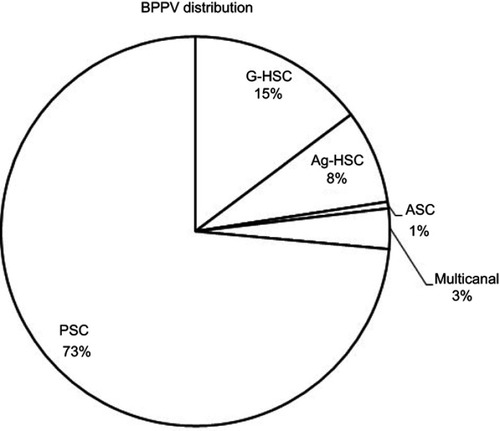
Table 2 Summary of studies comparing success rates of treatment maneuvers for Ag-HSC (%)
Table 3 Summary of studies comparing success rates of treatment maneuvers for G-HSC (%)