
Figures & data
Figure 1 Study population selection.
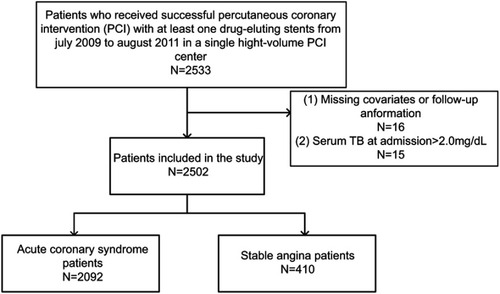
Table 1 Clinical information, laboratory tests and procedural characteristics
Table 2 In-hospital and follow-up outcomes in total population
Table 3 Factors related to TB by multiple linear regression analysis
Table 4 Associations between total bilirubin >0.60 mg/dL and clinical outcomes in total population
Figure 2 Correlation of total bilirubin (TB) with major adverse cardiovascular and cerebrovascular events. (A) Categorical TB with tertiles; (B) binary, continuous, logarithmic and quadratic TB.
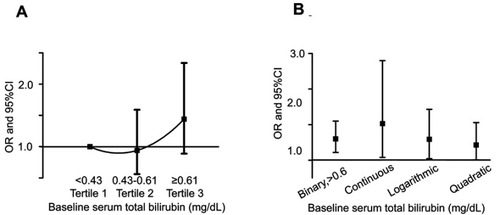
Figure 3 Plot of dose–response relationship between serum total bilirubin and MACE during follow-up (p nonlinear=0.208, p overall=0.025).
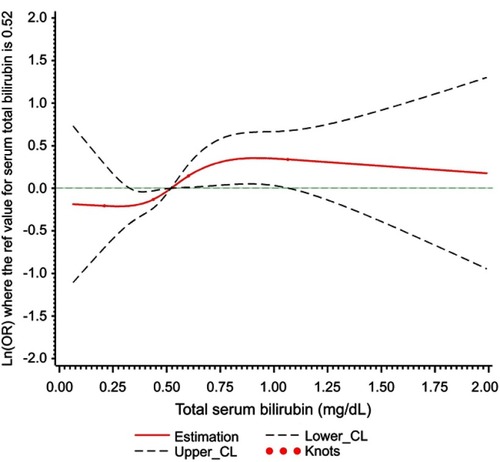
Table 5 Dose–response relationship between total serum bilirubin and long-term MACE
Figure 4 Associations between total bilirubin >0.60 mg/dL and clinical outcomes in ACS and SA patients.
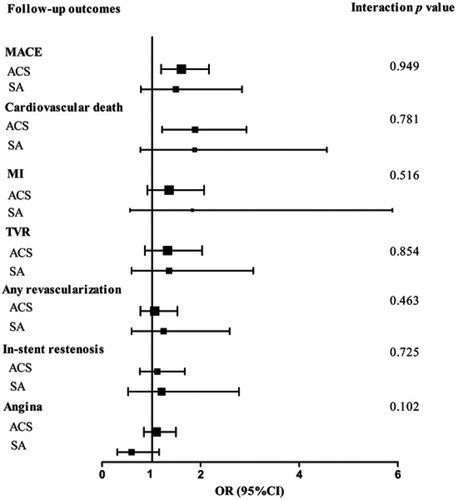
Table S1 In-hospital and follow-up outcomes in ACS and SA patients