Figures & data
Figure 1 Flow diagram of the selection process.
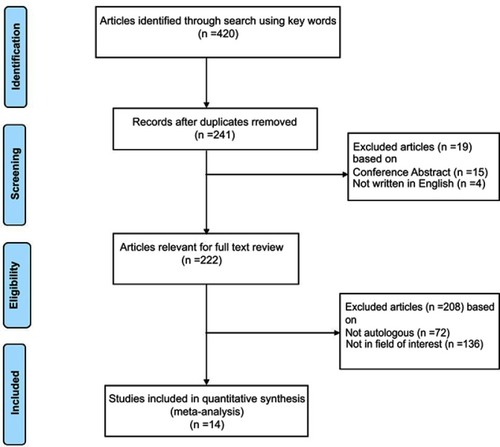
Table 1 Patients Characteristics
Table 2 Response rate subgroup analyses
Figure 2 Forest plot for response rate and 95% CI based on individual study and the entire study.
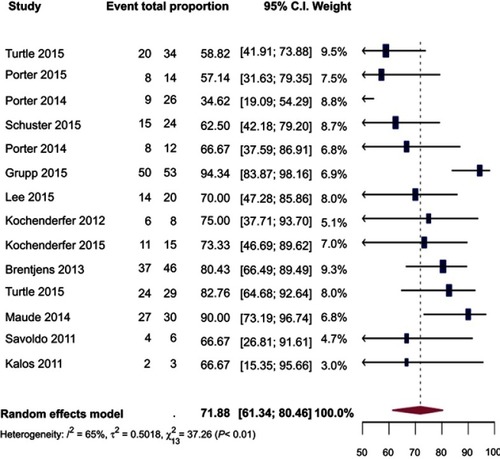
Figure 3 Forest plot for CRS toxicity and 95% CI based on individual study and the entire study.
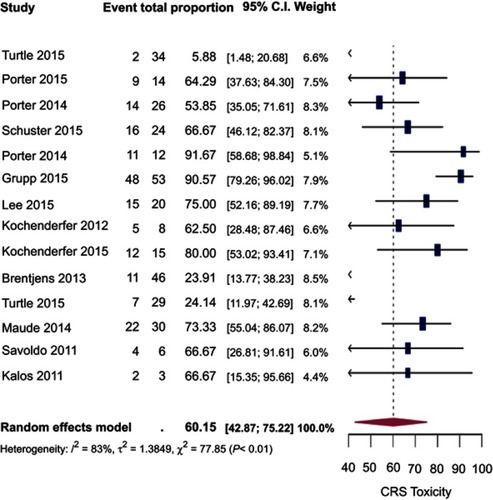
Table 3 Response rate subgroup analyses
Figure 4 Progression-free survival (PFS) curve.
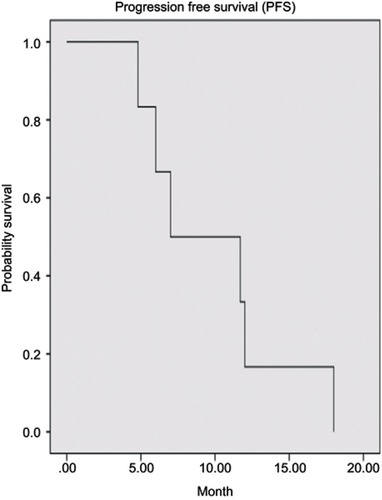
Figure 5 Overall survival (OS) curve.
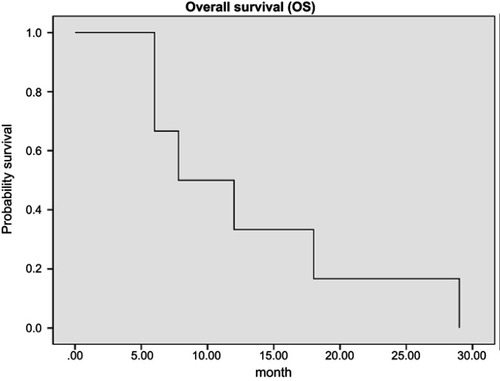
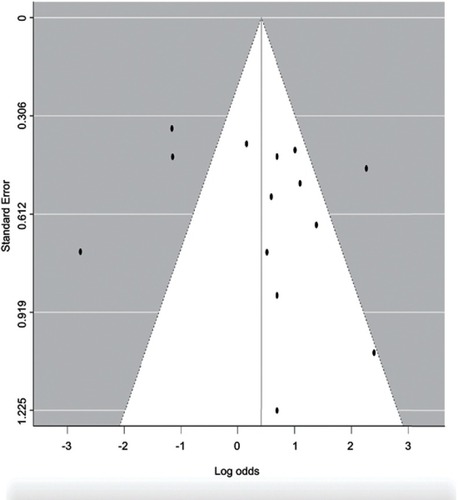
Figure 6 Funnel plot of response rate for publication bias.