Figures & data
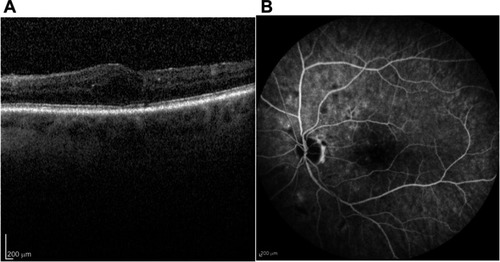
Figure 1 (A) SD-OCT scan of the left eye using spectralis -Heidelberg OCT module of the patient at presentation (B) Fluorescence angiography of the same eye using the same device (spectralis- Heidelberg) at presentation.
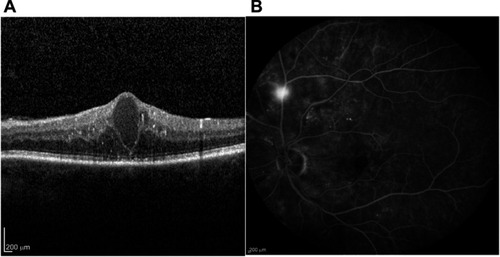
Figure 2 (A) SD-OCT scan of the same eye using the same device, 9 months after initiation of therapy. (B) Fluorescence angiography of the same eye using the same device, 9 months after initiation of therapy.
Abbreviations: SD-OCT, spectral domain optical coherence tomography; OD, oculus dextrus; OS, oculus sinister.