
Figures & data
Table 1 Hepatoprotective drugs included in the atorvastatin analyses
Figure 1 Waiting-time distributions for patients of atorvastatin and hepatoprotective drugs during the period January 2017 to December 2017.
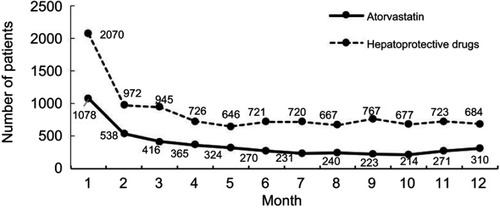
Figure 2 A flow chart of patients’ inclusion and exclusion.
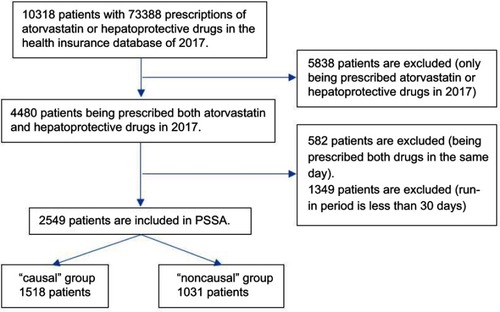
Figure 3 Frequency distribution of patients by days before or after atorvastatin initiation within 180 days.
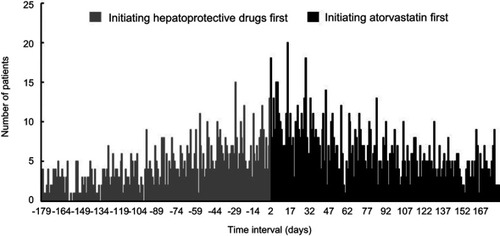
Table 2 Results from the atorvastatin analysis, by different characteristics