
Figures & data
Table 1 Univariate analyses of variables during the early stage of disease between the survival group and the fatal group.
Figure 1 Receiver operating characteristic (ROC) curves of the NLR taken within 24 h and other biomarkers for 180-day fatality.
Abbreviation: AUC, area under the curve.
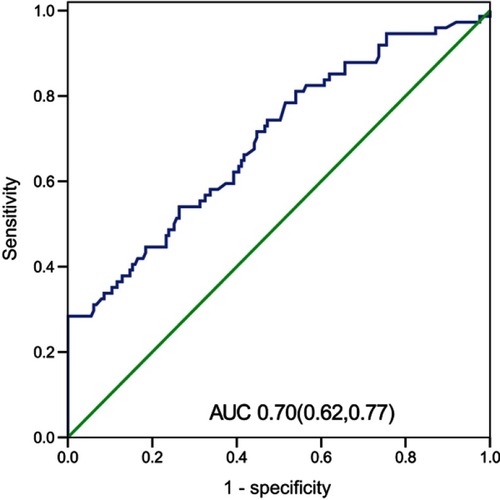
Figure 2 Kaplan–Meier analyses of the NLR ≥19.94 group and the NLR <19.94 group in patients infected with the AIV-H7N9 influenza virus.
Abbreviation: NLR, neutrophil-to-lymphocyte ratio.
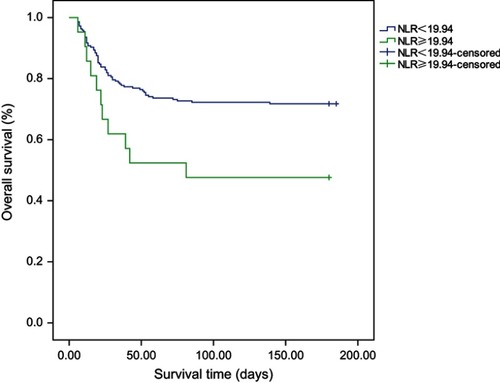
Table 2 Logistic regression analysis of independent outcomes predictor in AIV-H7N9-infected patients.
Availability of data and materials
The dataset used and analyzed during this study is available from the corresponding author upon request.