
Figures & data
Figure 1 Radial artery waveform.
Abbreviations: rAI, radial artery augmentation index; P2, systolic peak pressure 2; P1, systolic peak pressure 1.
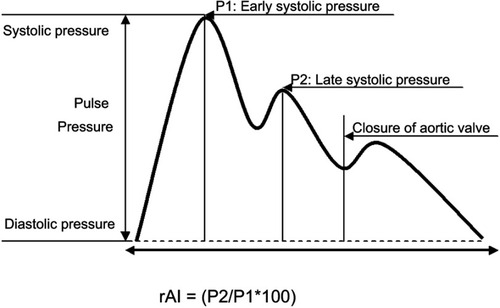
Figure 2 Data including procedure.
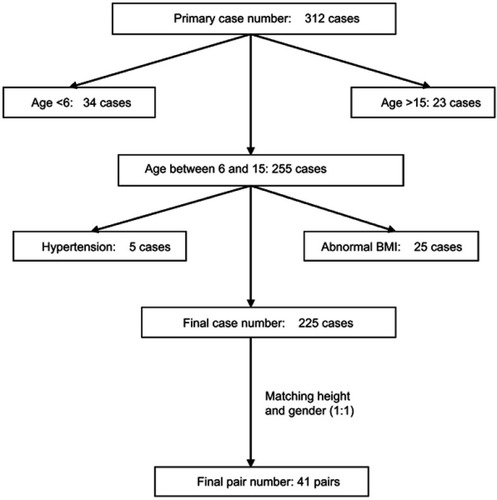
Table 1 Subject characteristics
Figure 3 Linear correlation between rAI and height.
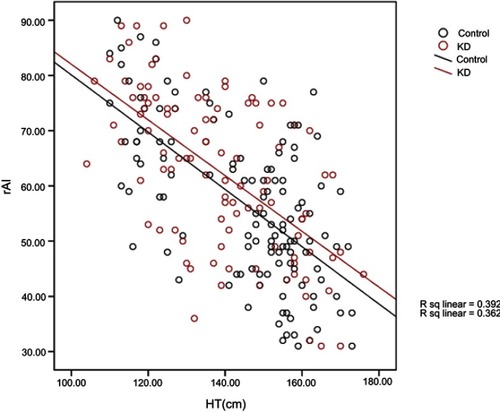
Figure 4 Linear correlation between rAI@75 and height.
Abbreviations: KD, Kawasaki disease; rAI, radial artery augmentation index; rAI@75, radial artery augmentation index adjusted to heart rate in 75 bpm.
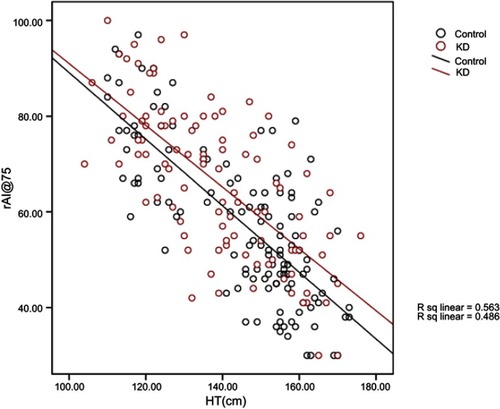
Table 2 Multivariable linear regression analysis for rAI
Table 3 Multivariable linear regression analysis for rAI@75
Figure 5 Comparison of rAI and rAI@75 after matching HT and sex.
Abbreviations: rAI, radial artery augmentation index; rAI@75, radial artery augmentation index adjusted to heart rate in 75 bpm.
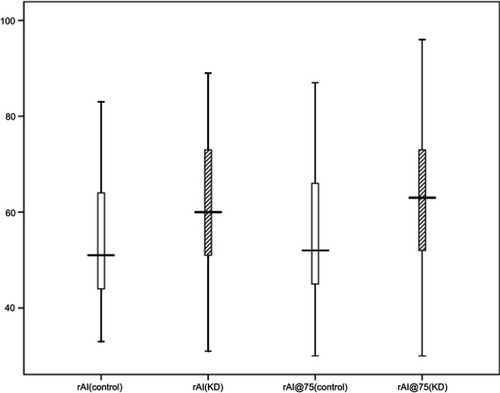
Table 4 Paired t-test after matching height and sex (1:1)
Table 5 Multivariable regression analysis for rAI and rAI@75 in KD subjects
Availability of data and materials
The primary data are open access on figshare and the DOI is as follows: