Figures & data
Table 1 Patients’ baseline characteristics
Figure 1 The SOFA score, APACHE II score, and the levels of presepsin, PCT and lactate upon admission in the survivor and non-survivor groups. (A and B) The levels of presepsin and lactate in the non-survivor group are significantly higher than those of the survivor group (presepsin: P=0.000; lactate: P=0.000). (C) There is no significant difference in the PCT level between the two groups (P=0.403). (D and E) The SOFA score and APACHE II score of the non-survivor group are significantly higher than those of the survivor group (SOFA score: P=0.000; APACHE II score: P=0.002).
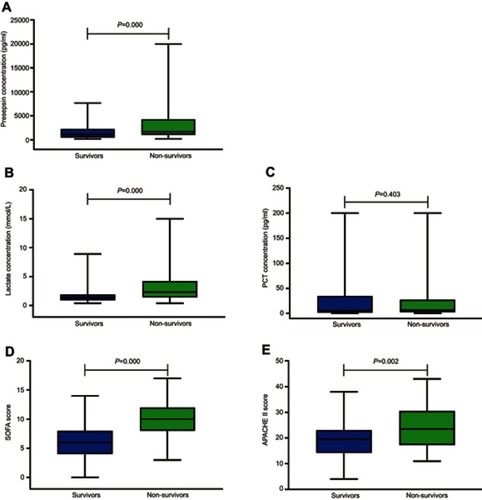
Table 2 Univariate binary logistic regression analysis results
Figure 2 Receiver operating characteristic curves of the presepsin level, lactate level, and the SOFA score in predicting patients’ in-hospital mortality. Areas under the receiver operating characteristic (ROC) curves: the lactate level (blue line): 0.711 (95% confidence interval (CI): 0.622 to 0.800, P=0.000); the presepsin level (red line): 0.703 (95% CI: 0.614 to 0.793, P=0.000); the SOFA score (green line): 0.793 (95% CI: 0.716 to 0.870, P=0.000); the SOFA score + the presepsin level (purple line): 0.817 (95% CI: 0.742 to 0.892, P=0.000). The AUC value of a combination of the SOFA score and the presepsin level is significantly larger than that of the SOFA score alone in predicting patients’ in-hospital mortality from sepsis (AUC: 0.817 vs 0.793, P=0.041).
Abbreviation: CI, confidence interval; SOFA score, Sequential Organ Failure Assessment score; APACHE II score, Acute Physiology and Chronic Health Evaluation II score.
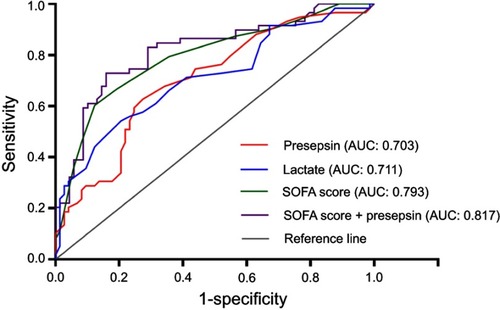
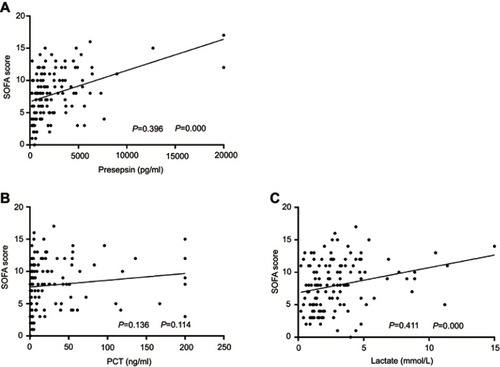
Figure 3 Association between the levels of presepsin, lactate,and PCT and the SOFA score. The levels of presepsin and lactate are positively correlated with the SOFA score (presepsin: ρ=0.396, P=0.000; lactate: ρ=0.411, P=0.000), while no correlation between the PCT level and the SOFA score is observed (ρ=0.136; P=0.114).