Figures & data
Table 1 Clinical characteristics and laboratory parameters of the studied patients (n=326)
Table 2 Correlation between serum β2-M level and duration and hs-CRP
Table 3 Result of multivariate logistic regression analysis showing predictors of hospital mortality of hemodialysis patients after 5 years
Figure 1 Receiver operating characteristics (ROC) curves of serum β2-M, hemodialysis duration and residual kidney function for prediction of hospital mortality of hemodialysis patients with all-causes. β2-M: AUC =0.898; p<0.001; Cut-off value: 74.9 mg/L, Se=93.3%, Sp=92.9%. Hemodialysis duration: AUC =0.907; p<0.001; Cut-off value: 63 months, Se=96%, Sp=78.9%. Urine 24 hrs volume: AUC =0.669; p<0.001; Cut-off value: 225 mL, Se=93.3%, Sp=38.2%. Serum β2-M concentration has an equal predictive value of mortality compared with hemodialysis duration and had a better predictive value than renal residual function in maintenance hemodialysis patients for 5 years.
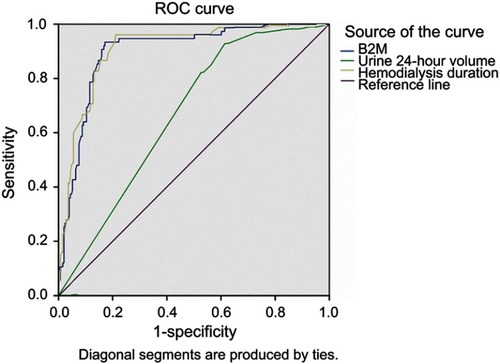
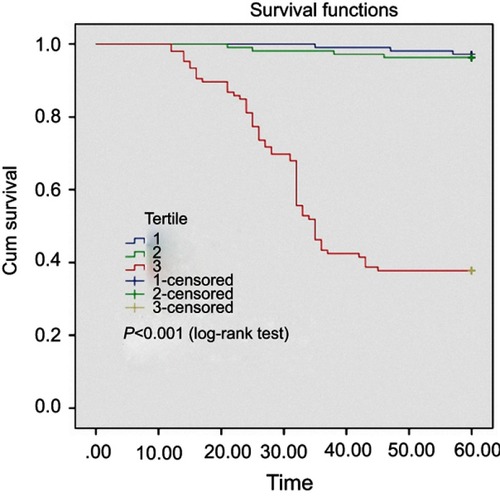
Figure 2 Kaplan–Meier analysis of all-causes mortality of 326 hemodialysis patients, classified according to β2-M concentrations in 3 groups A, B and C. Patients with higher β2-M concentrations (red line – group C) exhibited a significantly higher death rate compared to those with lower serum β2-M concentrations (blue line – group B and violet line – group A) (log-rank test, p<0.001).