Figures & data
Table 1 Main characteristics of the patients studied
Figure 1 Study timing.
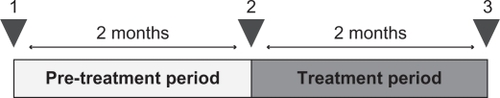
Table 2 Main plasma chemistry parameters analyzed
Figure 2 Clinical data from the BDIST during pre-treatment and treatment periods.
Notes: A) Pre-treatment period; (B) Treatment period. Horizontal axis: the different domains of the BDIS T and total score of it (TOTAL) are described. Vertical axis: score achived. Notice that different scales are used for (A) and (B). A) means and SD of the mean before (white bars) and after (grey bars) for each specific assessment. B) means and SD of the mean before (white bars) and after (grey bars) treatment period for each specific assessment. Statistical significance was calculated by comparing the data from the BDIST before and after the pre-treatment period (A) and the treatment period (B) (Wilcoxon signed-rank test). **P < 0.02 and ***P < 0.01.
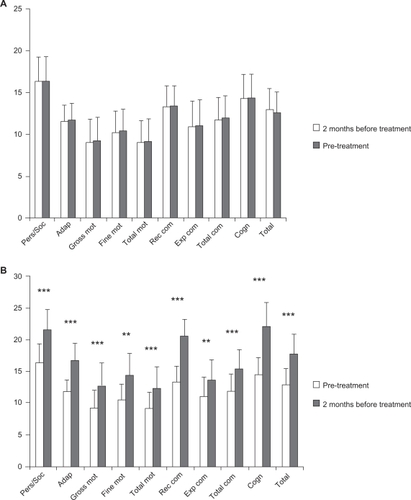
Figure 3 Comparison of improvements during pre-treatment and treatment periods.
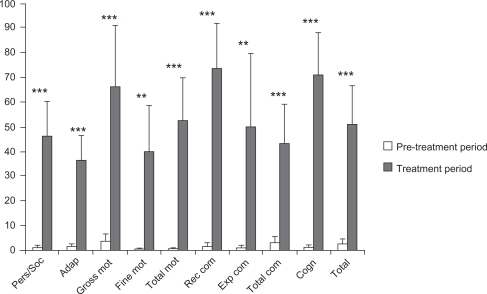
Table 3 Results obtained from the Battelle Developmental Inventory Screening Test (BDIST)