
Figures & data
Figure 1 Imaging of skull and vascularity. No abnormalities of occipital lobe were identified on (A) MRI, T2, (B) MRI, T1, and (C) CT. (D) Mild vertebral stenosis was shown on the computed tomographic angiography (arrow). (E) Visual evoked potential examination demonstrated a prolonged P100.
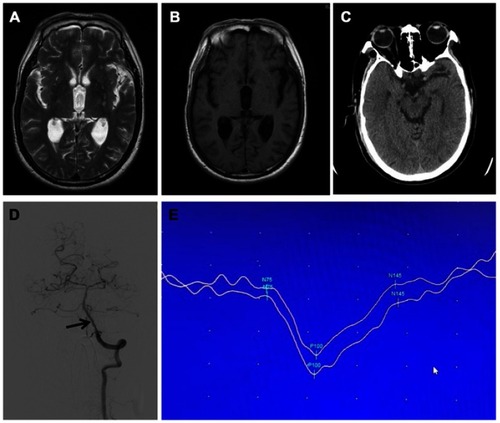
Table 1 The univariate analysis of risk factors for cortical visual impairment (n [%])
Table 2 The clinical presentation of visual impairment
Table 3 The multivariate logistic regression analysis for cortical visual impairment