
Figures & data
Figure 1 Flow diagram of this study.
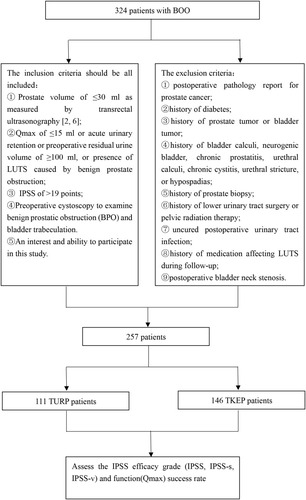
Table 1 Criteria For Determining The Efficacy Of Individual Domains (IPSS, IPSS-S, IPSS-V And Function) And Proportion Of Patients For Each Efficacy Grade
Table 2 Univariate Analysis Of Risk Factors For Postoperative Outcomes In Patients With Small-Volume Prostate
Figure 2 ROC curve of improved postoperative IPSS (A), IPSS-v (B), IPSS-s (C) and Qmax (D) in patients followed up for 3 months postoperatively.
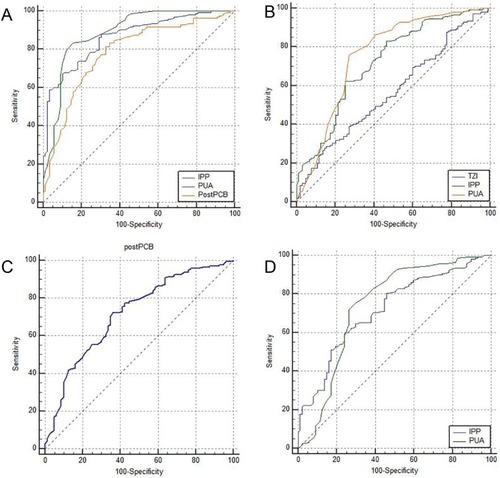
Figure 3 ROC curve of improved postoperative IPSS (A), IPSS-v (B), IPSS-s (C) and Qmax (D) in patients followed up for 12 months postoperatively.
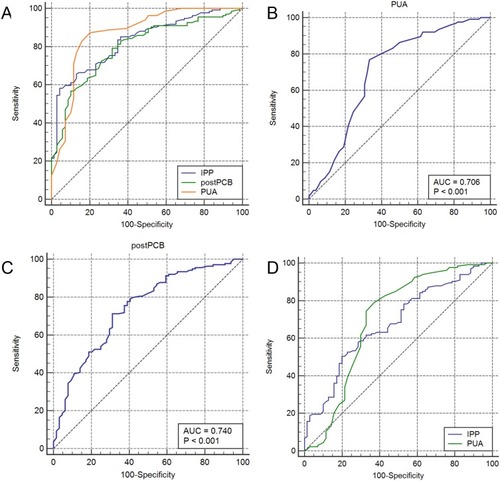
Figure 4 Zonal classification of the prostate and prostatic calculi.
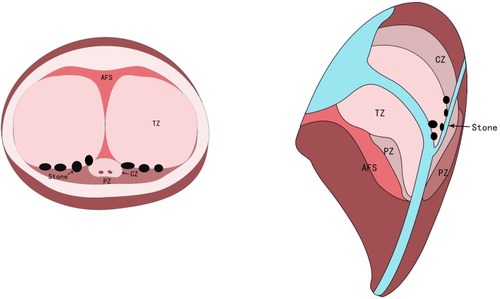
Figure 5 Prostate calculi between the adenoma and the surgical capsule were removed using electrocution during PKEP. (A) Prostatic calculi at 5-o’clock position (B) Prostatic calculi at 7-o’clock position. a: prostatic calculi; b: surgical capsule; c: electric cut loops; d: 5-o’clock position of hyperplasia gland lobe in prostate apex; e: 7-o’clock position of hyperplasia gland lobe in prostate apex.
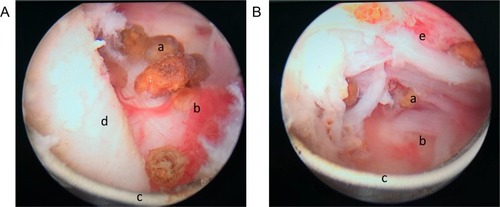
Table 3 Multivariate Analysis Of Risk Factors For Successful Treatment In Patients With Small-Volume Prostate
Table 4 Evaluation The Utility Of Different Variables For Predicting Treatment Success Using Receiver Operating Curve (ROC) Analysis
Table 5 Comparison Of Clinical Parameters Between The Two Surgical Procedures