Figures & data
Table 1 Characteristics of study subjects at the start of treatment
Figure 1 Changes in lumbar spine and total hip BMD.
Notes: Data are expressed as the mean ± SD. A one-way ANOVA with repeated measurements showed significant longitudinal changes in the lumbar spine BMD (P < 0.0001). The mean rates of change in the lumbar spine BMD after 1, 2, and 3 years of treatment were +11.3%, +12.4%, and +14.8%, respectively. However, total hip BMD did not change significantly (P = 0.8706). The mean rates of change in the total hip BMD after 1, 2, and 3 years of treatment were −0.5%, +3.2%, and +6.4%, respectively.
Abbreviations: ANOVA, analysis of variance; BMD, bone mineral density.
Abbreviations: ANOVA, analysis of variance; BMD, bone mineral density.
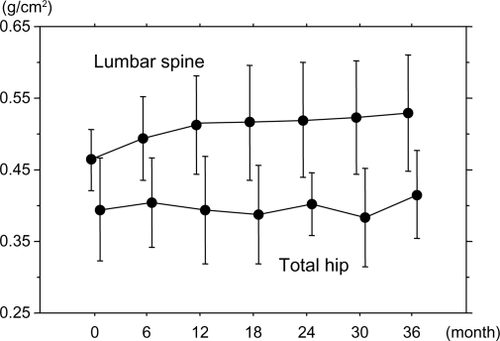
Figure 2 Changes in biochemical markers.
Notes: Data are expressed as the mean ± SD. A one-way ANOVA with repeated measurements showed significant longitudinal changes in the serum ALP and urinary NTX levels (both P < 0.0001). The mean rates of change in the urinary NTX levels after 3 months of treatment were −42.5%. The mean rates of change in the serum ALP levels after 1, 2, and 3 years of treatment were −26.1%, −20.5%, and −18.9%, respectively. However, the serum calcium and phosphorus levels did not change significantly (P = 0.0760 and 0.8799, respectively).
Abbreviations: ANOVA, analysis of variance; ALP, alkaline phosphatase; NTX, cross linked N-terminal telopeptides of type I collagen; BCE, bone collagen equivalent; Cr, creatinine.
Abbreviations: ANOVA, analysis of variance; ALP, alkaline phosphatase; NTX, cross linked N-terminal telopeptides of type I collagen; BCE, bone collagen equivalent; Cr, creatinine.
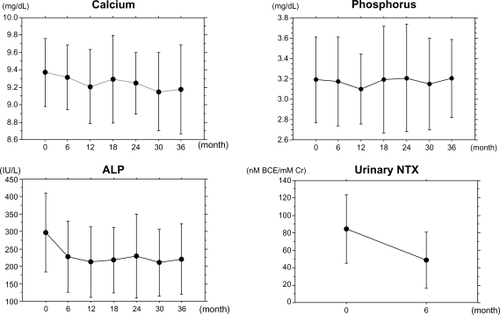
Table 2 Incidence of vertebral and nonvertebral fractures