
Figures & data
Table 1 Characteristics and Distribution of Endodontically Treated Teeth
Table 2 Causes of Extraction of Endodontically Treated Teeth
Figure 1 (A) Estimated survival function of ETT as a function of individuals’ gender (males n = 1305: females n = 2702). (B) Estimated survival function of ETT as a function of type of restoration (composite buildup n = 650; Crown n = 3362). (C) Kaplan-Meier survival curve as a function of time of placement of the final coronal restoration. The 8-year survival of ETT which received final coronal restoration from 0 to 14 days was 72%, from 15 to 59 days was 51% and after 60+ days was 39%.
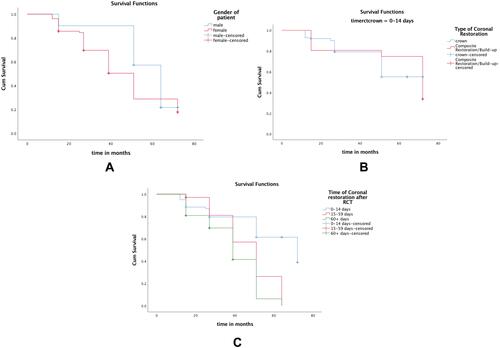
Table 3 Eight-Year Survival Table for Endodontically Treated Teeth