
Figures & data
Figure 1 Cohort enrolment and follow-up among patients initiating first-line ART in South Africa Pre-UTT vs during UTT.
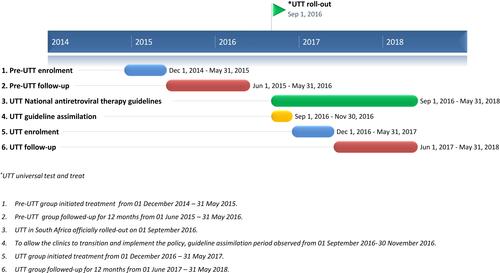
Figure 2 Cohort selection.
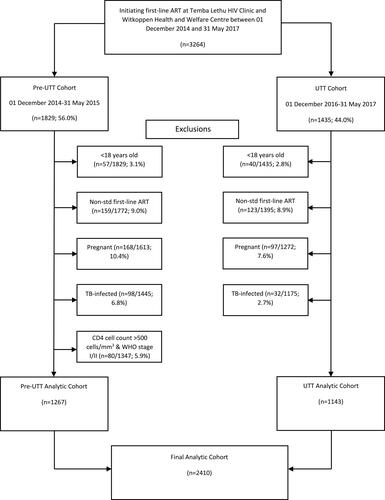
Table 1 Demographic and Clinical Characteristics at Treatment Initiation Among Patients Initiating ART in South Africa Pre-UTT vs During UTT
Table 2 Treatment Outcomes at 12 Months on Treatment Among Patients Initiating ART in South Africa Pre-UTT vs During UTT
Table 3 Unadjusted and Adjusted Estimates of the Relation Between Pre-UTT Initiation and UTT Initiation on LTFU
Table 4 Unadjusted and Adjusted Estimates of the Relation Between Pre-UTT Initiation and UTT Initiation on LTFU Among Patients Initiating Treatment with a CD4 Cell Count ≤500 Copies/mm3
Figure 3 Kaplan-Meier survival estimates of lost to follow-up among patients initiating ART in South Africa Pre-UTT vs during UTT (n=2410).
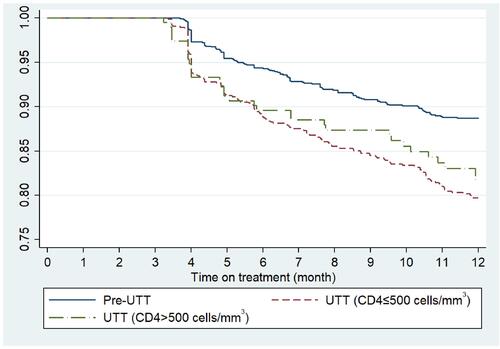
Table 5 Unadjusted and Adjusted Estimates of the Relation Between Pre-UTT Initiation and UTT Initiation on Virologic Suppression at 12 Months (VL≤400 Copies/mL)