Figures & data
Table 1 Preoperative Blood Tests
Table 2 Hormones Measured on the Morning of Fasting
Figure 1 75 g oral glucose tolerance test Horizontal axes indicate time courses. Vertical axes indicate levels of glucose (circles, solid line) and IRI levels (triangles, dotted line).
Abbreviation: IRI, immunoreactive insulin.
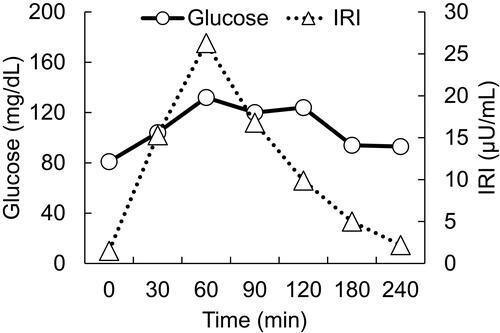
Figure 2 Magnetic resonance imaging of the pituitary. T1-weighted magnetic resonance images, without contrast, are shown. Left, Sagittal plane. Right, coronal plane. Yellow arrows indicate an empty sella.
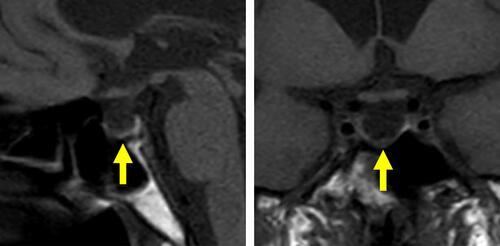
Figure 3 Abdominal computed tomography. Horizontal computed tomography images, without contrast, are shown. Yellow arrows indicate right and left atrophic adrenal glands.
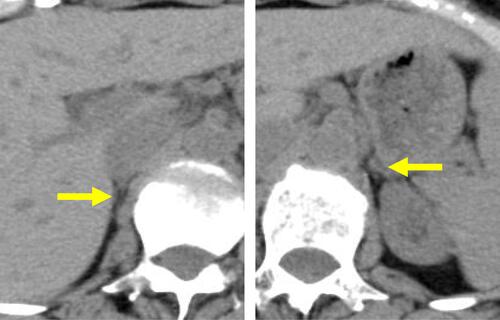
Figure 4 Pituitary stimulation tests. (A) Corticotropin-releasing hormone test. ACTH, circles and solid line. Cortisol, triangles and dotted line. (B) Thyrotropin-releasing hormone test. TSH, circles and solid line. PRL, triangles and dotted line. (C) Gonadotropin-releasing hormone test. LH, circles and solid line. FSH, triangles and dotted line. (D) Growth hormone-releasing peptide-2. GH, circles and solid line. Horizontal axes indicate time courses. Vertical axes indicate hormone levels.
Abbreviations: ACTH, adrenocorticotropic hormone; FSH, follicle-stimulating hormone; GH, growth hormone; LH, luteinizing hormone; PRL, prolactin; TSH, thyroid-stimulating hormone.
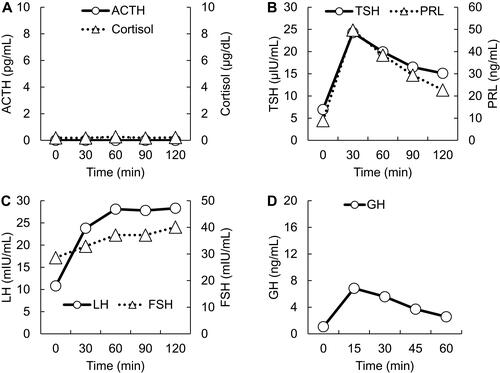
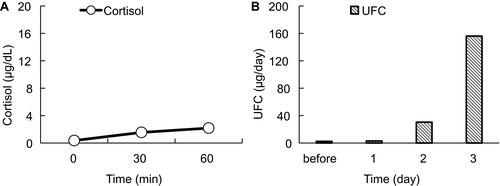
Figure 5 ACTH stimulation tests. (A) Conventional dose rapid ACTH stimulation test using 250 µg synacthen. Circles and a solid line represent the serum cortisol level. (B) Prolonged ACTH stimulation test using 0.5 mg tetracosactide twice daily. Vertical gray columns represent UFC. Horizontal axes indicate time courses. Vertical axes indicate values.
Abbreviations: ACTH, adrenocorticotropic hormone; UFC, urinary free cortisol.