Figures & data
Table 1 Characteristics of the Participants by Different Serum Homocysteine Levels
Table 2 Homocysteine Levels in Different Gender and Age Groups
Figure 1 Outcome events of 1257 participants.
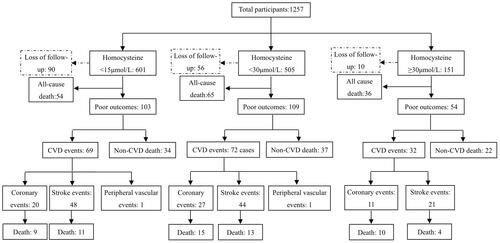
Table 3 The Relationship Between Homocysteine Level and CVD Events and Death
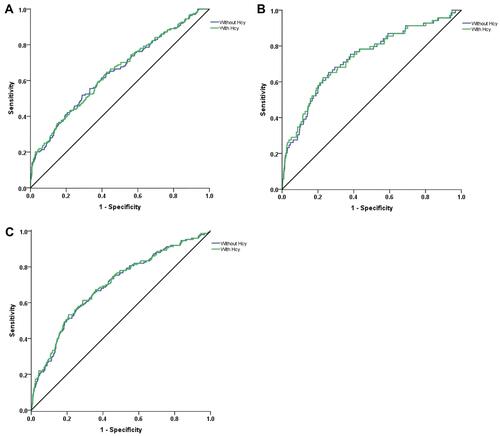
Table 4 The Area Under the Curve of ROC Curve
Figure 2 Receiver-operating characteristic curves for (A) CVD events, (B) CVD death, and (C) all-cause death during 4.84-year follow-up. For each endpoint, curves are based on prediction models adjusted for conventional risk factors (sex, age, smoking, alcohol drinking, glucose, hs-CRP, dyslipidemia, eGFR, pulse pressure, hypoglycemic therapy, lipid-lowering therapy and antihypertensive therapy) with or without homocysteine (Hcy).