Figures & data
Figure 1 Study flow diagram.
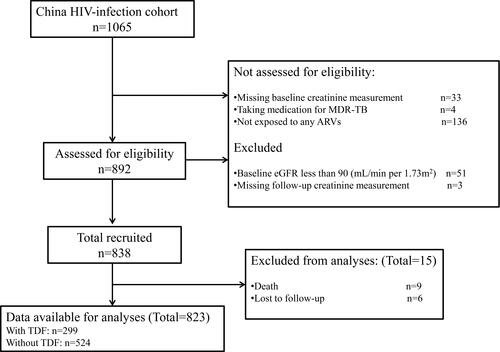
Table 1 The Difference of Slopes Before and After Cutoff Times and Comparison of One-Linear and Piecewise-Linear Models
Table 2 Characteristics at Cohort Entry Stratified by Tenofovir Disoproxil Fumarate Before and After Propensity Score Matching
Table 3 Predicted eGFR Change Rates in the Piecewise-Linear Mixed Effects Model
Table 4 Association of Antiretroviral Exposure (in Different Time Ranges) with Risk of Renal Impairment Outcomes
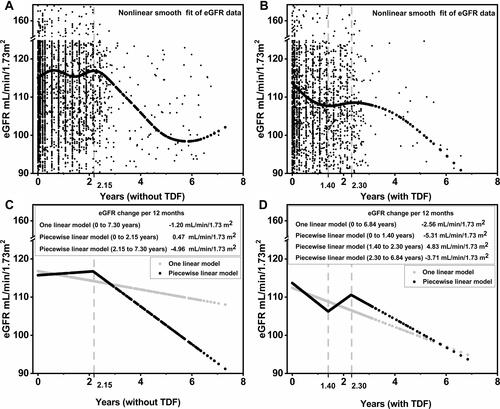
Figure 2 Nonlinear trajectory of eGFR among HIV-1-infected patients with or without TDF.
Notes: Nonlinear eGFR changes over time can be approximated with a piecewise-linear mixed effects model. (A) and (B) show the adjusted smooth fit of eGFR data. (C) and (D) show the fit from the adjusted one linear and adjusted piecewise-linear mixed effects models. Models adjusted for age, sex, weight, height, BMI, CD4 count, eGFR, dyslipidemia, HIV/AIDS risk factors (sexual orientation and intravenous drug use), WHO stage III/IV HIV/AIDS, hepatitis B positivity, hepatitis C positivity, anemia, diabetes, and HIV-1 RNA viral load at baseline.