Figures & data
Table 1 Demographics and Clinical Characteristics of Total Cohort
Figure 1 Fitting curve for the mortality increased with the degree of renal insufficiency by 3 eGFR equations: CG, FAS, and CKD-EPI.
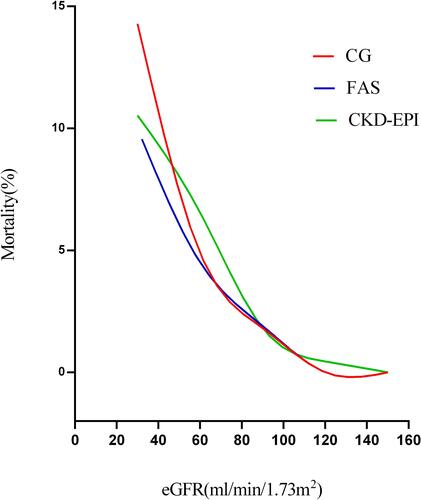
Figure 2 Bland–Altman plots for the difference between 3 eGFR equations. Preoperative and postoperative eGFR were calculated and analyzed, respectively. (A) The Bland–Altman plot determined by preoperative CG and CKD-EPI; (B) the Bland–Altman plot determined by preoperative CG and FAS; (C) the Bland–Altman plot determined by preoperative CKD-EPI and FAS; (D) the Bland–Altman plot determined by postoperative CG and CKD-EPI; (E) the Bland–Altman plot determined by postoperative CG and FAS; (F) the Bland–Altman plot determined by postoperative CKD-EPI and FAS.
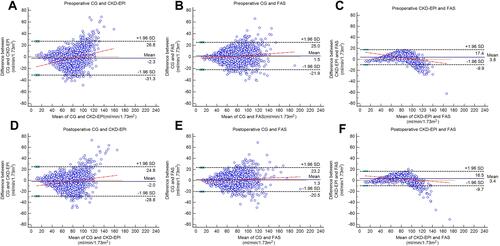
Table 2 Comparison of AUC for CG, FAS, and CKD-EPI Equations
Table 3 Comparison of NRI for CG, FAS, and CKD-EPI Equations
Figure 3 Decision curve analysis for the in-hospital death by 3 eGFR equations: CG, FAS, and CKD-EPI. (A) The decision curves determined by preoperative eGFR; (B) the decision curves determined by postoperative eGFR.
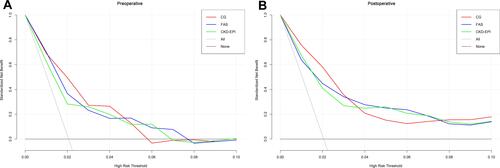
Table 4 Multivariate Logistic Regression Models for In-Hospital Mortality and Multivariable Cox Proportional Hazards Models for Long-Term Mortality
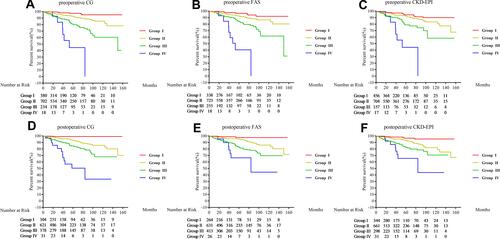
Figure 4 Kaplan–Meier curves for the survival rate of 4 renal function grades determined by 3 eGFR equations. Preoperative and postoperative renal function grades were calculated and analyzed, respectively. (A) Kaplan–Meier curves determined by preoperative CG; (B) Kaplan–Meier curves determined by preoperative FAS; (C) Kaplan–Meier curves determined by preoperative CKD-EPI; (D) Kaplan–Meier curves determined by postoperative CG; (E) Kaplan–Meier curves determined by postoperative FAS; (F) Kaplan–Meier curves determined by postoperative CKD-EPI.