Figures & data
Figure 1 53-year-old male with esophageal cancer. (A and B) Preoperative X-ray showed bone destruction at L1~L4; (C and D) Preoperative MRI showed multiple spine metastases (L1~L4); (E) MRI showed transversal spine metastases at L1, and it had deformation of the dural sac, but without spinal cord or nerve root compression; (F) MRI showed transversal spine metastases at L2, and it had epidural impingement, but without deformation of the dural sac; (G) MRI showed transversal spine metastases at L3, and it had complete posterior wall; (H) MRI showed transversal spine metastases at L4, and it had complete posterior wall. The pattern diagrams were shown just below the transversal MRI image of L1 to L4. It indicated that L1 was classified into group C, L2 was classified into group B, and L3 and L4 were classified into group A. And the patient was classified into group C.
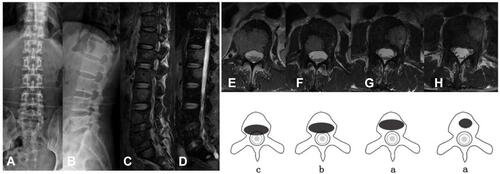
Table 1 Preoperative Clinical Characteristics of Patients
Table 2 Postoperative Pain and Function Improvements
Figure 2 VAS in the three groups before and after surgery (* indicates P ˂0.01, as compared with pre-operative VAS.
Abbreviation: Pre-OP, pre-operation; Post-OP, post-operation.
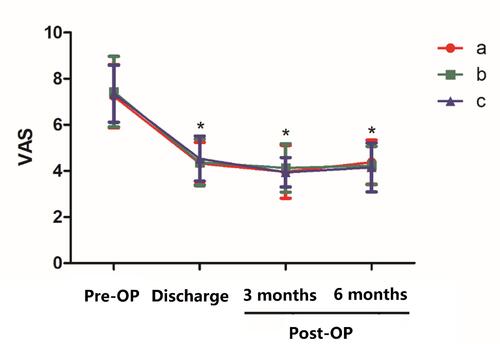
Table 3 Cement Leakage Distribution in Different Groups of Vertebrae
Figure 3 A 59-year-old male with lung cancer who treated with PVP suffered from intra-spinal canal cement leakage. (A) CT sagittal plane showed T8 and T10 destructions; (B) CT horizontal plane of T8; (C) CT horizontal plane of T10; (D) MRI sagittal plane showed T8 metastatic lesion and T10 metastatic spinal cord compression; (E) MRI horizontal plane of T8; (F) MRI horizontal plane of T10; (G and H) postoperative X-ray; (I) CT horizontal plane of T8 showed intra-spinal canal cement leakage; (J) CT horizontal plane of T10 showed intra-spinal canal cement leakage.
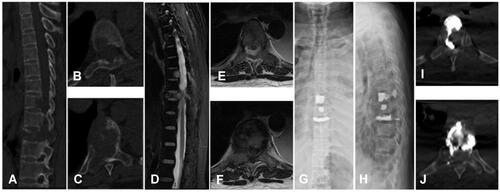
Table 4 Risk Factors for Intra-Spinal Canal Cement Leakage
Figure 4 ROC curves for variables of vertebrae collapse (ROC=0.60), groups (ROC=0.69), Bilsky scale (ROC=0.71), and model including all the three significant factors (ROC=0.73).
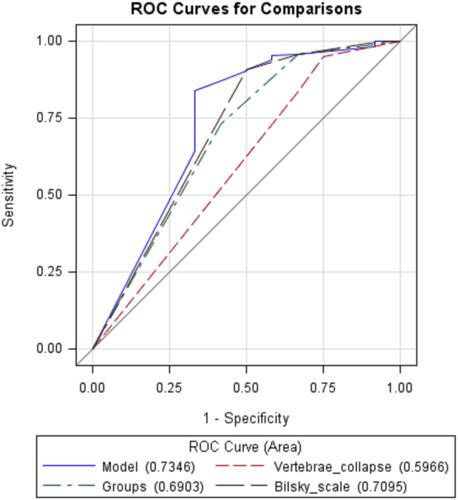
Table 5 An Algorithm to Calculate Injected Bone Cement Volumes
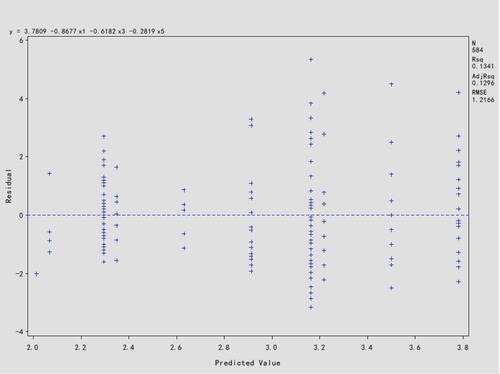
Figure 5 Residual plot for fitting effectiveness of multiple linear regression: The formula was Y=3.1627–0.8677×treated vertebrae level (x1)–0.6182×cortical osteolytic destruction in posterior wall (x3)–0.2819×Bilsky scale (x5).