
Figures & data
Figure 1 Flowing chart of population enrollment.
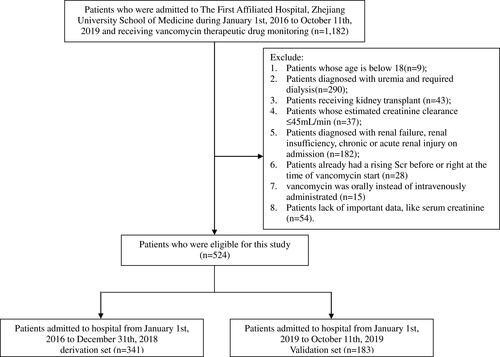
Table 1 Baseline Characteristics in the Derivation and Validation Cohorts
Table 2 Predictors Included in the Multivariable Logistic Regression Model
Figure 2 The AKI risk score nomogram for clinical application and AKI incidence by score decile.
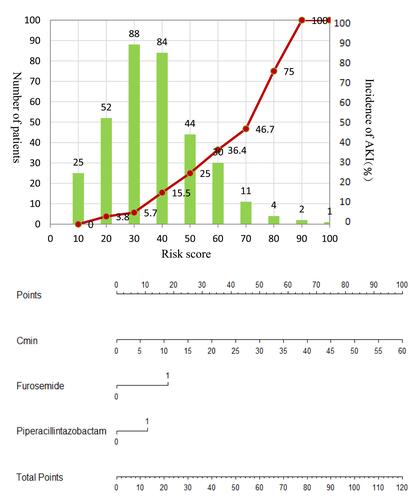
Figure 3 The ROC curve in the derivation (A) and external validation sets (B).
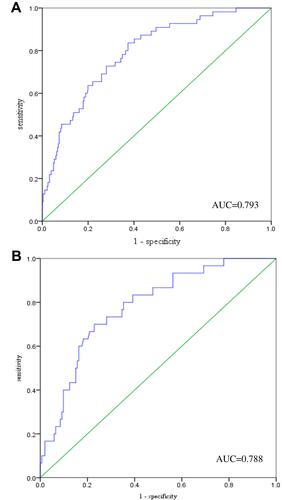
Figure 4 Calibration plot in the derivation and validation sets.
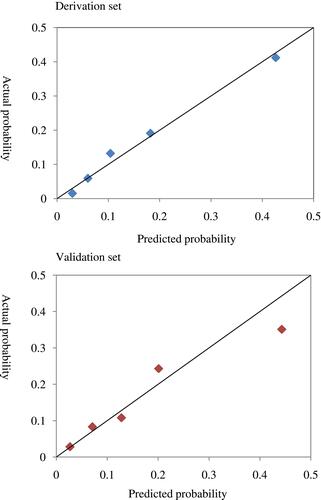
Figure 5 Incidence of AKI after treatment with vancomycin in both derivation and validation sets stratified by score quartiles: score <25 (very low risk), score 25–50 quartile (low risk), score 50–75 (moderate risk), and score ≥75 (high risk).
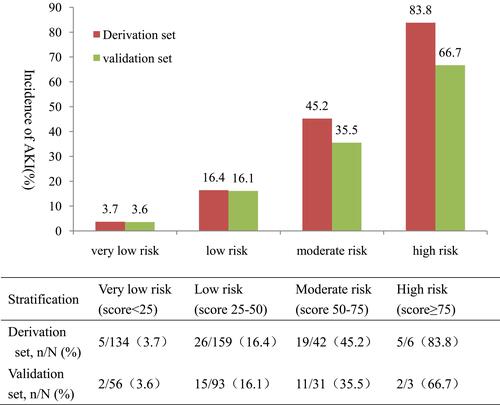
Table 3 Discriminative, Reclassification Ability and AIC of Our Established Risk Score in the Derivation and Validation Cohort in Comparison with Existing AKI Prediction Models in Patients Treated with Vancomycin